• 文献检索
  • 文档翻译
  • 深度研究
  • 学术资讯
  • Suppr Zotero 插件Zotero 插件
  • 邀请有礼
  • 套餐&价格
  • 历史记录
应用&插件
Suppr Zotero 插件Zotero 插件浏览器插件Mac 客户端Windows 客户端微信小程序
定价
高级版会员购买积分包购买API积分包
服务
文献检索文档翻译深度研究API 文档MCP 服务
关于我们
关于 Suppr公司介绍联系我们用户协议隐私条款
关注我们

Suppr 超能文献

核心技术专利:CN118964589B侵权必究
粤ICP备2023148730 号-1Suppr @ 2026

文献检索

告别复杂PubMed语法,用中文像聊天一样搜索,搜遍4000万医学文献。AI智能推荐,让科研检索更轻松。

立即免费搜索

文件翻译

保留排版,准确专业,支持PDF/Word/PPT等文件格式,支持 12+语言互译。

免费翻译文档

深度研究

AI帮你快速写综述,25分钟生成高质量综述,智能提取关键信息,辅助科研写作。

立即免费体验

利用2001 - 2018年美国国家健康与营养检查调查(NHANES)分析美国成年人添加糖摄入量及来源的趋势。

Trends in added sugars intake and sources among U.S. adults using the National Health and Nutrition Examination Survey (NHANES) 2001-2018.

作者信息

DiFrancesco Loretta, Fulgoni Victor L, Gaine P Courtney, Scott Maria O, Ricciuto Laurie

机构信息

Source! Nutrition, Toronto, ON, Canada.

Nutrition Impact, LLC, Battle Creek, MI, United States.

出版信息

Front Nutr. 2022 Aug 18;9:897952. doi: 10.3389/fnut.2022.897952. eCollection 2022.

DOI:10.3389/fnut.2022.897952
PMID:36061886
原文链接:https://pmc.ncbi.nlm.nih.gov/articles/PMC9434277/
Abstract

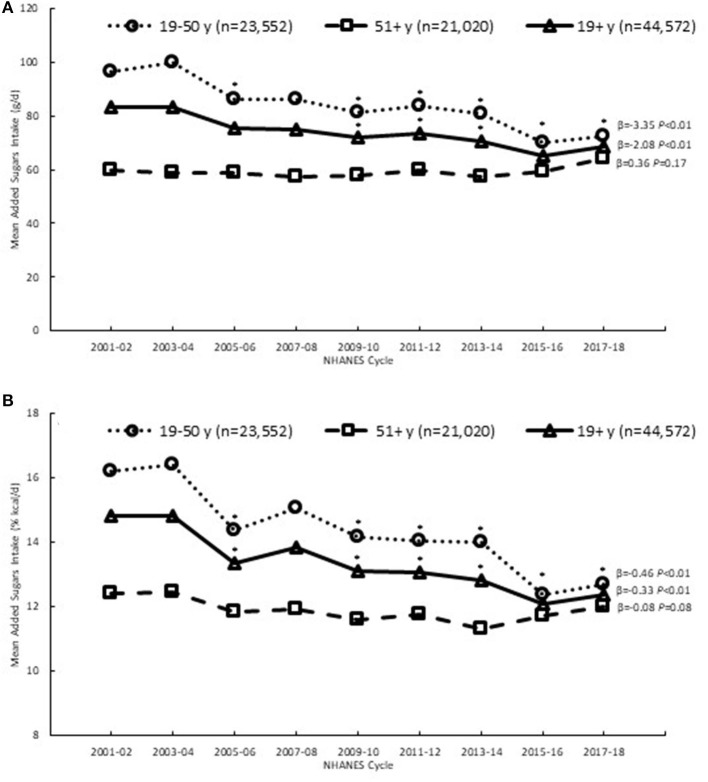
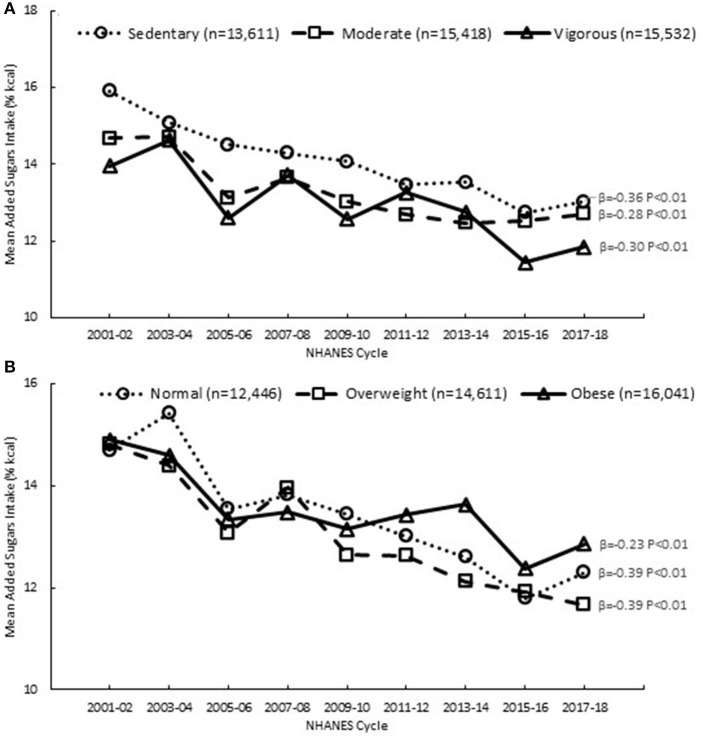
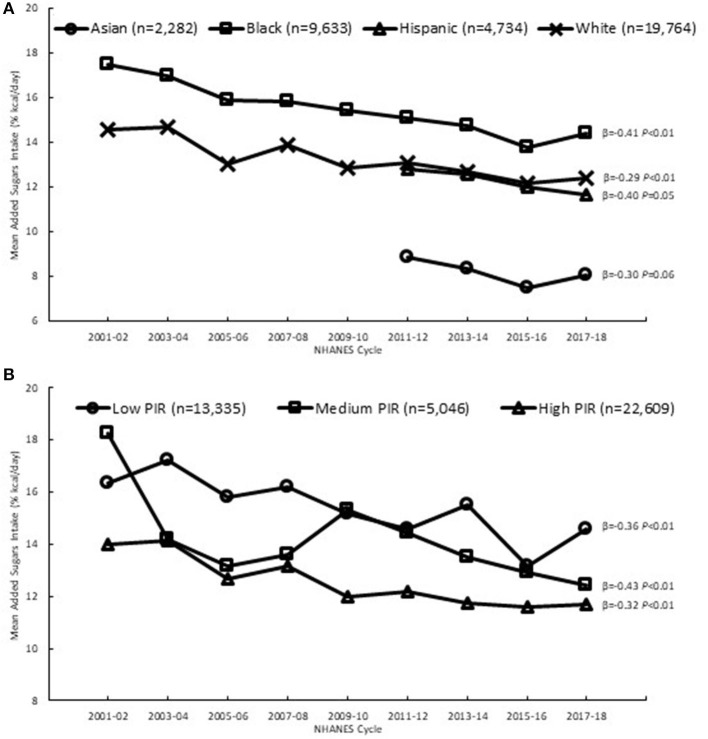
Research on trends over time in added sugars intake is important to help gain insights into how population intakes change with evolving dietary guidelines and policies on reducing added sugars. The purpose of this study was to provide an analysis of dietary trends in added sugars intakes and sources among U.S. adults from 2001 to 2018, with a focus on variations according to the sociodemographic factors, age, sex, race and ethnicity and income, and the health-related factors, physical activity and body weight. Data from nine consecutive 2 year cycles of the National Health and Nutrition Examination Survey (NHANES) were combined and regression analyses were conducted to test for trends in added sugars intake and sources from 2001 to 2018. Trends were examined in the whole sample (19+ years) and in subsamples stratified by age (19-50, 51+ years), sex, race and ethnicity (Asian, Black, Hispanic, White), household income (poverty income ratio low, medium, high), physical activity level (sedentary, moderate, vigorous) and body weight status (normal, overweight, obese). From 2001 to 2018, added sugars intake (% kcal) decreased significantly ( < 0.01), from 16.2 to 12.7% among younger adults (19-50 years), mainly due to declines in added sugars from sweetened beverages, which remained the top source. There were no changes in intake among older adults, and by 2018, the 23% difference in intake between younger and older adults that existed in 2001 almost disappeared. Declines in added sugars intake were similar among Black and White individuals, and all income, physical activity and body weight groups. Population-wide reductions in added sugars intake among younger adults over an 18 year time span coincide with the increasing public health focus on reducing added sugars intake. With the updated Nutrition Facts label now displaying added sugars content, it remains to be seen how added sugars intake trends carry forward in the future.

摘要

研究添加糖摄入量随时间的变化趋势,对于深入了解随着饮食指南和减少添加糖政策的不断演变,人群摄入量如何变化非常重要。本研究的目的是分析2001年至2018年美国成年人添加糖摄入量及来源的饮食趋势,重点关注社会人口学因素(年龄、性别、种族和民族以及收入)和健康相关因素(身体活动和体重)的差异。将连续九个两年周期的国家健康与营养检查调查(NHANES)数据合并,并进行回归分析,以检验2001年至2018年添加糖摄入量及来源的趋势。在整个样本(19岁及以上)以及按年龄(19 - 50岁、51岁及以上)、性别、种族和民族(亚洲人、黑人、西班牙裔、白人)、家庭收入(贫困收入比低、中、高)、身体活动水平(久坐、适度、剧烈)和体重状况(正常、超重、肥胖)分层的子样本中研究趋势。从2001年到2018年,年轻成年人(19 - 50岁)的添加糖摄入量(占千卡的百分比)显著下降(<0.01),从16.2%降至12.7%,主要原因是含糖饮料中的添加糖减少,含糖饮料仍是首要来源。老年人的摄入量没有变化,到2018年,2001年年轻和老年人之间存在的23%的摄入量差异几乎消失。黑人和白人个体以及所有收入、身体活动和体重组的添加糖摄入量下降情况相似。在18年的时间跨度内,年轻成年人中添加糖摄入量在全人群范围内的减少与公共卫生对减少添加糖摄入量的关注度增加相吻合。随着更新后的营养成分标签现在显示添加糖含量,未来添加糖摄入量趋势将如何发展还有待观察。

https://cdn.ncbi.nlm.nih.gov/pmc/blobs/82d7/9434277/e5adaf93c226/fnut-09-897952-g0003.jpg
https://cdn.ncbi.nlm.nih.gov/pmc/blobs/82d7/9434277/ee48e43937db/fnut-09-897952-g0001.jpg
https://cdn.ncbi.nlm.nih.gov/pmc/blobs/82d7/9434277/76c726128398/fnut-09-897952-g0002.jpg
https://cdn.ncbi.nlm.nih.gov/pmc/blobs/82d7/9434277/e5adaf93c226/fnut-09-897952-g0003.jpg
https://cdn.ncbi.nlm.nih.gov/pmc/blobs/82d7/9434277/ee48e43937db/fnut-09-897952-g0001.jpg
https://cdn.ncbi.nlm.nih.gov/pmc/blobs/82d7/9434277/76c726128398/fnut-09-897952-g0002.jpg
https://cdn.ncbi.nlm.nih.gov/pmc/blobs/82d7/9434277/e5adaf93c226/fnut-09-897952-g0003.jpg

相似文献

1
Trends in added sugars intake and sources among U.S. adults using the National Health and Nutrition Examination Survey (NHANES) 2001-2018.利用2001 - 2018年美国国家健康与营养检查调查(NHANES)分析美国成年人添加糖摄入量及来源的趋势。
Front Nutr. 2022 Aug 18;9:897952. doi: 10.3389/fnut.2022.897952. eCollection 2022.
2
Trends in Added Sugars Intake and Sources Among US Children, Adolescents, and Teens Using NHANES 2001-2018.美国儿童、青少年 2001-2018 年添加糖摄入量和来源的变化趋势:NHANES 研究
J Nutr. 2022 Feb 8;152(2):568-578. doi: 10.1093/jn/nxab395.
3
Sources of Added Sugars Intake Among the U.S. Population: Analysis by Selected Sociodemographic Factors Using the National Health and Nutrition Examination Survey 2011-18.美国人群添加糖摄入来源:利用2011 - 2018年国家健康与营养检查调查按选定社会人口学因素进行的分析
Front Nutr. 2021 Jun 17;8:687643. doi: 10.3389/fnut.2021.687643. eCollection 2021.
4
Added Sugars Intake Across the Distribution of US Children and Adult Consumers: 1977-2012.1977 - 2012年美国儿童和成年消费者群体中添加糖的摄入量
J Acad Nutr Diet. 2016 Oct;116(10):1543-1550.e1. doi: 10.1016/j.jand.2016.06.003. Epub 2016 Aug 1.
5
High Added Sugars Intake among US Adults: Characteristics, Eating Occasions, and Top Sources, 2015-2018.美国成年人高糖摄入量:特征、摄入场合和主要来源,2015-2018 年。
Nutrients. 2023 Jan 4;15(2):265. doi: 10.3390/nu15020265.
6
Trends in intakes and sources of solid fats and added sugars among U.S. children and adolescents: 1994-2010.1994 - 2010年美国儿童及青少年的固体脂肪和添加糖摄入量及来源趋势
Pediatr Obes. 2013 Aug;8(4):307-24. doi: 10.1111/j.2047-6310.2013.00156.x. Epub 2013 Apr 2.
7
Intakes of Added Sugars, with a Focus on Beverages and the Associations with Nutrient Adequacy in US Adults (NHANES 2003-2018).美国成年人(NHANES 2003-2018)添加糖摄入量,重点关注饮料和与营养充足性的关联。
Nutrients. 2023 Sep 9;15(18):3916. doi: 10.3390/nu15183916.
8
Beverage intake among preschool children and its effect on weight status.学龄前儿童的饮料摄入量及其对体重状况的影响。
Pediatrics. 2006 Oct;118(4):e1010-8. doi: 10.1542/peds.2005-2348.
9
Assessing the Public's Comprehension of Dietary Guidelines: Use of MyPyramid or MyPlate Is Associated with Healthier Diets among US Adults.评估公众对膳食指南的理解:美国成年人使用 MyPyramid 或 MyPlate 与更健康的饮食相关。
J Acad Nutr Diet. 2019 Mar;119(3):482-489. doi: 10.1016/j.jand.2018.09.012. Epub 2018 Dec 15.
10
Decreasing Trends in Heavy Sugar-Sweetened Beverage Consumption in the United States, 2003 to 2016.美国含糖饮料摄入量呈下降趋势,2003 年至 2016 年。
J Acad Nutr Diet. 2020 Dec;120(12):1974-1985.e5. doi: 10.1016/j.jand.2020.07.012. Epub 2020 Sep 24.

引用本文的文献

1
Characterization of the physicochemical properties and key aroma compounds of Beijing roast duck skin sugared by water-in-oil nanoemulsion.水包油纳米乳液糖渍北京烤鸭皮的理化性质及关键香气成分表征
Food Chem X. 2025 Jun 14;29:102666. doi: 10.1016/j.fochx.2025.102666. eCollection 2025 Jul.
2
The Association of Nativity and Time in the United States on Added Sugar Consumption.美国出生情况与时间对添加糖消费的影响
Curr Dev Nutr. 2025 Feb 7;9(3):104563. doi: 10.1016/j.cdnut.2025.104563. eCollection 2025 Mar.
3
Sugar-sweetened beverage intake, gut microbiota, circulating metabolites, and diabetes risk in Hispanic Community Health Study/Study of Latinos.

本文引用的文献

1
Sources of Added Sugars Intake Among the U.S. Population: Analysis by Selected Sociodemographic Factors Using the National Health and Nutrition Examination Survey 2011-18.美国人群添加糖摄入来源:利用2011 - 2018年国家健康与营养检查调查按选定社会人口学因素进行的分析
Front Nutr. 2021 Jun 17;8:687643. doi: 10.3389/fnut.2021.687643. eCollection 2021.
2
Trends in Food Sources and Diet Quality Among US Children and Adults, 2003-2018.美国儿童和成人的食物来源和饮食质量趋势,2003-2018 年。
JAMA Netw Open. 2021 Apr 1;4(4):e215262. doi: 10.1001/jamanetworkopen.2021.5262.
3
Trends and patterns in sugar-sweetened beverage consumption among children and adults by race and/or ethnicity, 2003-2018.
西班牙裔社区健康研究/拉丁裔研究中的含糖饮料摄入量、肠道微生物群、循环代谢物与糖尿病风险
Cell Metab. 2025 Mar 4;37(3):578-591.e4. doi: 10.1016/j.cmet.2024.12.004. Epub 2025 Jan 31.
4
The Philadelphia Beverage Tax and Pediatric Weight Outcomes.费城饮料税与儿童体重结果
JAMA Pediatr. 2025 Jan 1;179(1):46-54. doi: 10.1001/jamapediatrics.2024.4782.
5
Associations of the Philadelphia sweetened beverage tax with changes in adult body weight: an interrupted time series analysis.费城甜味饮料税与成人体重变化的关联:一项中断时间序列分析。
Lancet Reg Health Am. 2024 Oct 12;39:100906. doi: 10.1016/j.lana.2024.100906. eCollection 2024 Nov.
6
Trends in Toddler Diet Quality in the United States: 1999 to 2018.美国幼儿饮食质量趋势:1999 年至 2018 年。
Pediatrics. 2024 Dec 1;154(6). doi: 10.1542/peds.2024-067783.
7
Factors Driving Individuals' Attitudes toward Sugar and Sweet-Tasting Foods: An Analysis within the Scope of Theory of Planned Behavior.影响个体对糖及甜味食品态度的因素:基于计划行为理论的分析
Foods. 2024 Sep 28;13(19):3109. doi: 10.3390/foods13193109.
8
Glycaemic sugar metabolism and the gut microbiota: past, present and future.血糖代谢与肠道微生物群:过去、现在与未来。
FEBS J. 2025 Mar;292(6):1421-1436. doi: 10.1111/febs.17293. Epub 2024 Oct 2.
9
Sugar and sugar-sweetened beverages in relation to premature aging in adult survivors of childhood cancer.儿童期癌症幸存者成年后与糖和含糖饮料与过早衰老的关系。
Br J Cancer. 2024 Oct;131(7):1169-1177. doi: 10.1038/s41416-024-02815-3. Epub 2024 Aug 8.
10
U.S. food policy to address diet-related chronic disease.美国食品政策应对与饮食相关的慢性病。
Front Public Health. 2024 May 16;12:1339859. doi: 10.3389/fpubh.2024.1339859. eCollection 2024.
2003-2018 年按种族和/或民族划分的儿童和成人含糖饮料消费的趋势和模式。
Public Health Nutr. 2021 Jun;24(9):2405-2410. doi: 10.1017/S1368980021001580. Epub 2021 Apr 12.
4
National Health and Nutrition Examination Survey, 2015-2018: Sample Design and Estimation Procedures.2015-2018 年全国健康与营养调查:样本设计和估计程序。
Vital Health Stat 2. 2020 Apr(184):1-35.
5
The impact of sugar-sweetened beverage taxes on purchases: Evidence from four city-level taxes in the United States.含糖饮料税对购买行为的影响:来自美国四个城市层面税收的证据。
Health Econ. 2020 Oct;29(10):1289-1306. doi: 10.1002/hec.4141. Epub 2020 Jul 28.
6
Decreasing Trends in Heavy Sugar-Sweetened Beverage Consumption in the United States, 2003 to 2016.美国含糖饮料摄入量呈下降趋势,2003 年至 2016 年。
J Acad Nutr Diet. 2020 Dec;120(12):1974-1985.e5. doi: 10.1016/j.jand.2020.07.012. Epub 2020 Sep 24.
7
Types and Amounts of Nonnutritive Sweeteners Purchased by US Households: A Comparison of 2002 and 2018 Nielsen Homescan Purchases.美国家庭购买的非营养性甜味剂的种类和数量:2002 年和 2018 年尼尔森家庭扫描购买的比较。
J Acad Nutr Diet. 2020 Oct;120(10):1662-1671.e10. doi: 10.1016/j.jand.2020.04.022. Epub 2020 Jul 29.
8
Trends in Dietary Carbohydrate, Protein, and Fat Intake and Diet Quality Among US Adults, 1999-2016.美国成年人 1999-2016 年饮食碳水化合物、蛋白质和脂肪摄入及饮食质量的变化趋势。
JAMA. 2019 Sep 24;322(12):1178-1187. doi: 10.1001/jama.2019.13771.
9
Differential relationship between physical activity and intake of added sugar and nutrient-dense foods: A cross-sectional analysis.体力活动与添加糖和营养密集型食物摄入的差异关系:一项横断面分析。
Appetite. 2019 Sep 1;140:91-97. doi: 10.1016/j.appet.2019.05.010. Epub 2019 May 7.
10
Sources of Added Sugars in Young Children, Adolescents, and Adults with Low and High Intakes of Added Sugars.低、高添加糖摄入量的幼儿、青少年和成年人的添加糖来源。
Nutrients. 2018 Jan 17;10(1):102. doi: 10.3390/nu10010102.