Department of Nutrition and Gerontology, German Institute of Human Nutrition Potsdam - Rehbruecke, Nuthetal, Germany.
NutriAct - Competence Cluster Nutrition Research Berlin-Potsdam, Nuthetal, Germany.
J Cachexia Sarcopenia Muscle. 2023 Feb;14(1):157-166. doi: 10.1002/jcsm.13118. Epub 2022 Nov 14.
Frailty development is partly dependent on multiple factors like low levels of nutrients and high levels of oxidative stress (OS) and inflammation potentially leading to a muscle-catabolic state. Measures of specific biomarker patterns including nutrients, OS and inflammatory biomarkers as well as muscle related biomarkers like 3-methylhistidine (3MH) may improve evaluation of mechanisms and the complex networks leading to frailty.
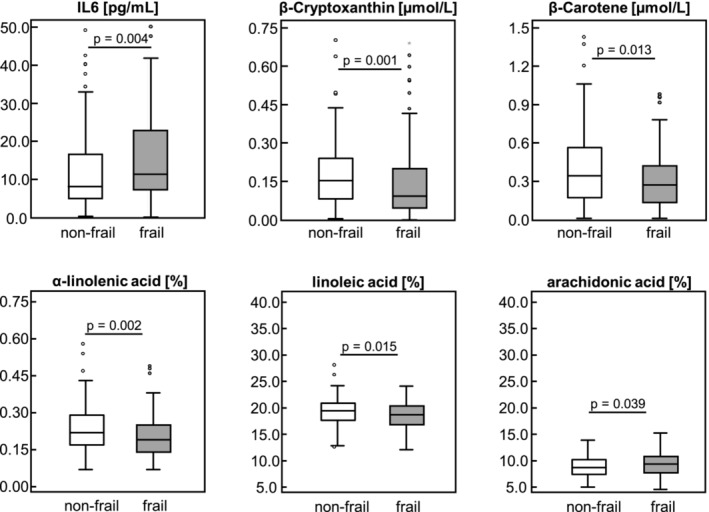
In 220 multi-morbid patients (≥ 60 years), classified as non-frail (n = 104) and frail (n = 116) according to Fried's frailty criteria, we measured serum concentrations of fat-soluble micronutrients, amino acids (AA), OS, interleukins (IL) 6 and 10, 3MH (biomarker for muscle protein turnover) and serum spectra of fatty acids (FA). We evaluated biomarker patterns by principal component analysis (PCA) and their cross-sectional associations with frailty by multivariate logistic regression analysis.
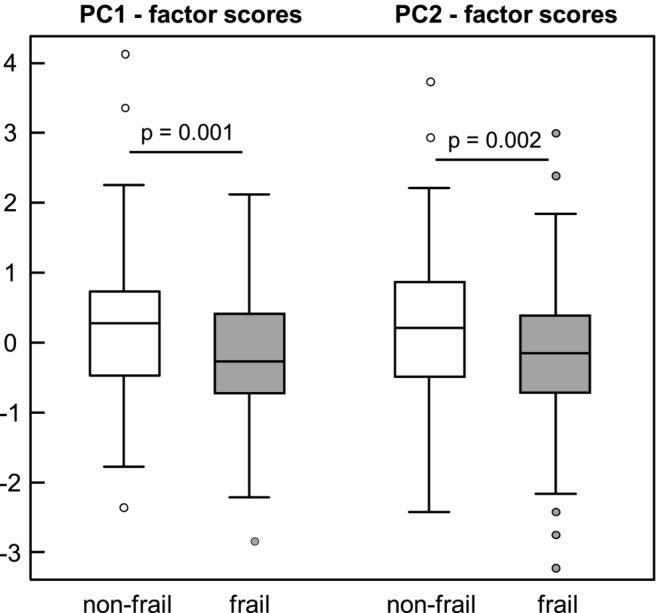
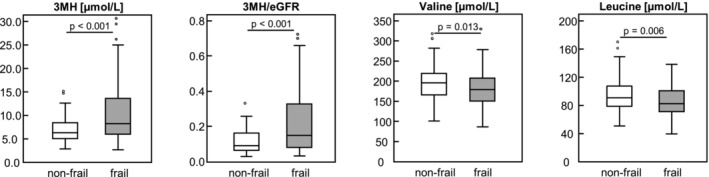
Two biomarker patterns [principal components (PC)] were identified by PCA. PC1 was characterized by high positive factor loadings (FL) of carotenoids, anti-inflammatory FA and vitamin D together with high negative FL of pro-inflammatory FA, IL6 and IL6/IL10, reflecting an inflammation-related pattern. PC2 was characterized by high positive FL of AA together with high negative FL of 3MH-based biomarkers, reflecting a muscle-related pattern. Frail patients had significantly lower factor scores than non-frail patients for both PC1 [median: -0.27 (interquartile range: 1.15) vs. 0.27 (1.23); P = 0.001] and PC2 [median: -0.15 (interquartile range: 1.13) vs. 0.21 (1.38); P = 0.002]. Patients with higher PC1 or PC2 factor scores were less likely to be frail [odds ratio (OR): 0.62, 95% CI: 0.46-0.83, P = 0.001 for PC1; OR: 0.64, 95% CI: 0.48-0.86, P = 0.003 for PC2] compared with patients with lower PC1 or PC2 factor scores. This indicates that increasing levels of anti-inflammatory biomarkers and increasing levels of muscle-anabolic biomarkers are associated with a reduced likelihood (38% and 36%, respectively) for frailty. Significant associations remained after adjusting the regression models for potential confounders.
We conclude that two specific patterns reflecting either inflammation-related or muscle-related biomarkers are both significantly associated with frailty among multi-morbid patients and that these specific biomarker patterns are more informative than single biomarker analyses considering frailty identification.
虚弱的发展部分取决于多种因素,例如低水平的营养物质和高水平的氧化应激(OS)和炎症,这可能导致肌肉分解代谢状态。包括营养物质、OS 和炎症生物标志物以及与肌肉相关的生物标志物(如 3-甲基组氨酸(3MH))的特定生物标志物模式的测量可能会改善对导致虚弱的机制和复杂网络的评估。
在 220 名患有多种疾病的患者(≥60 岁)中,根据弗莱德的虚弱标准将其分为非虚弱(n=104)和虚弱(n=116),我们测量了血清中脂溶性微量营养素、氨基酸(AA)、OS、白细胞介素(IL)6 和 10、3MH(肌肉蛋白周转率的生物标志物)和血清脂肪酸谱。我们通过主成分分析(PCA)评估生物标志物模式,并通过多元逻辑回归分析评估其与虚弱的横断面关联。
通过 PCA 确定了两个生物标志物模式[主成分(PC)]。PC1 的特征是类胡萝卜素、抗炎脂肪酸和维生素 D 的高正因子负荷(FL),以及促炎脂肪酸、IL6 和 IL6/IL10 的高负 FL,反映了与炎症相关的模式。PC2 的特征是 AA 的高正 FL,以及基于 3MH 的生物标志物的高负 FL,反映了肌肉相关的模式。虚弱患者的 PC1 [中位数:-0.27(四分位距:1.15)比非虚弱患者 0.27(1.23);P=0.001]和 PC2 [中位数:-0.15(四分位距:1.13)比非虚弱患者 0.21(1.38);P=0.002]的因子得分明显低于非虚弱患者。具有较高 PC1 或 PC2 因子得分的患者不太可能虚弱[比值比(OR):0.62,95%置信区间(CI):0.46-0.83,P=0.001 用于 PC1;OR:0.64,95% CI:0.48-0.86,P=0.003 用于 PC2]与 PC1 或 PC2 因子得分较低的患者相比。这表明,抗炎生物标志物水平升高和肌肉合成代谢生物标志物水平升高与虚弱的可能性降低(分别为 38%和 36%)相关。在调整潜在混杂因素的回归模型后,这些关联仍然显著。
我们得出的结论是,反映炎症相关或肌肉相关生物标志物的两种特定模式都与多系统疾病患者的虚弱显著相关,并且这些特定的生物标志物模式比考虑虚弱识别的单一生物标志物分析更具信息性。