Liu An-Shu, Fan Zhi-Hong, Lu Xue-Jiao, Wu Yi-Xue, Zhao Wen-Qi, Lou Xin-Ling, Hu Jia-Hui, Peng Xi-Yi-He
College of Food Science and Nutritional Engineering, China Agricultural University, Beijing, China.
Key Laboratory of Precision Nutrition and Food Quality, Department of Nutrition and Health, China Agricultural University, Beijing, China.
Front Nutr. 2022 Oct 31;9:977278. doi: 10.3389/fnut.2022.977278. eCollection 2022.
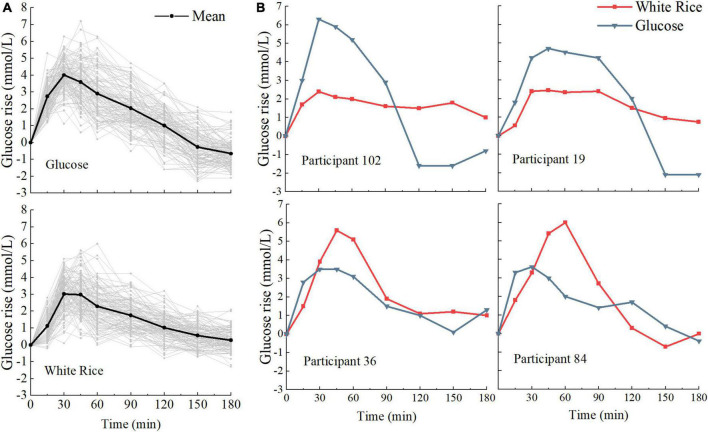
Large interpersonal variability in postprandial glycemic response (PGR) to white rice has been reported, and differences in the PGR patterns during the oral glucose tolerance test (OGTT) have been documented. However, there is scant study on the PGR patterns of white rice. We examined the typical PGR patterns of white rice and glucose and the association between them.
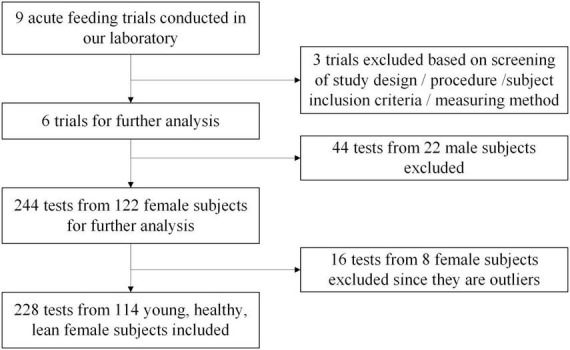
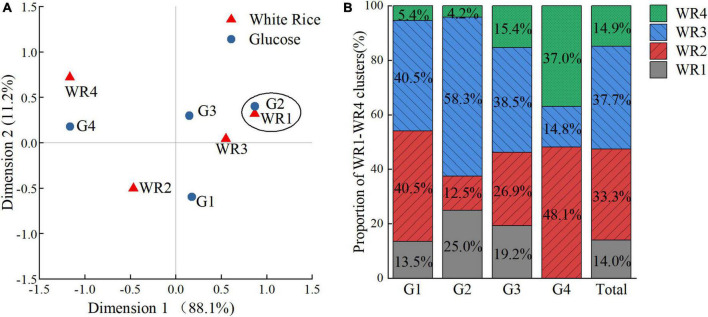
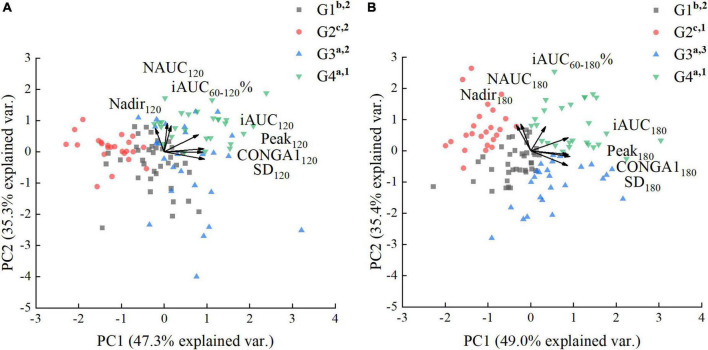
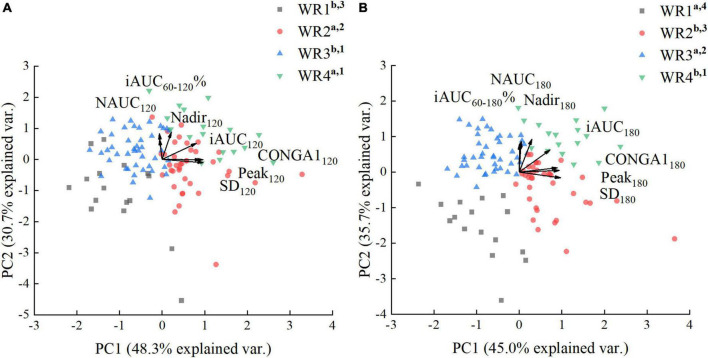
We analyzed the data of 3-h PGRs to white rice (WR) and glucose (G) of 114 normoglycemic female subjects of similar age, weight status, and same ethnic group. Diverse glycemic parameters, based on the discrete blood glucose values, were calculated over 120 and 180 min. K-means clustering based on glycemic parameters calculated over 180 min was applied to identify subgroups and representative PGR patterns. Principal factor analysis based on the parameters used in the cluster analysis was applied to characterize PGR patterns. Simple correspondence analysis was performed on the clustering categories of WR and G.
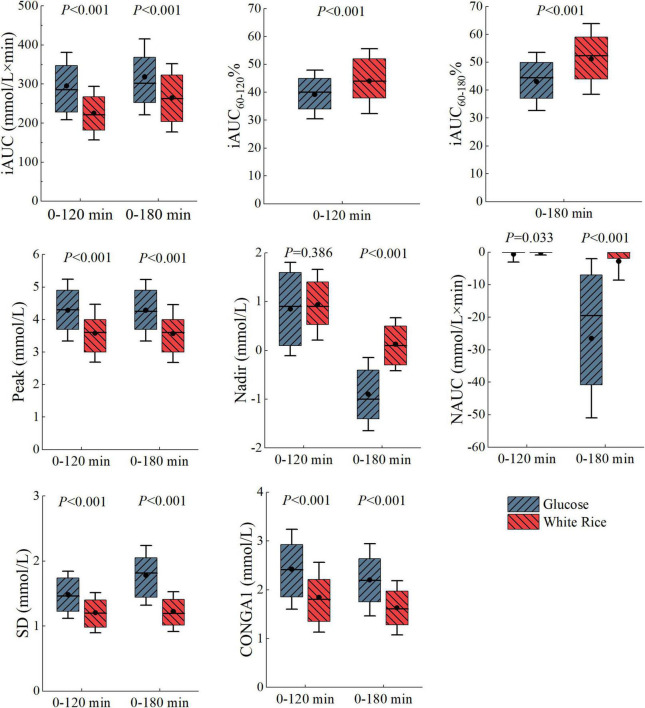
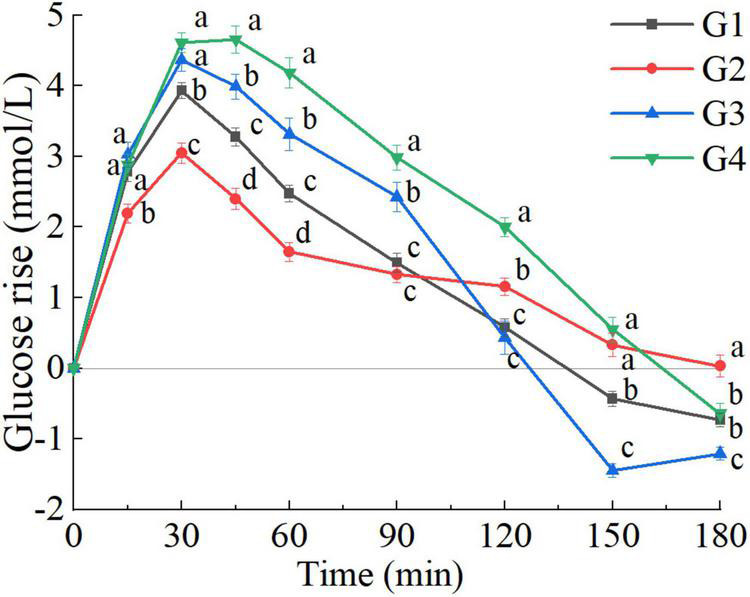
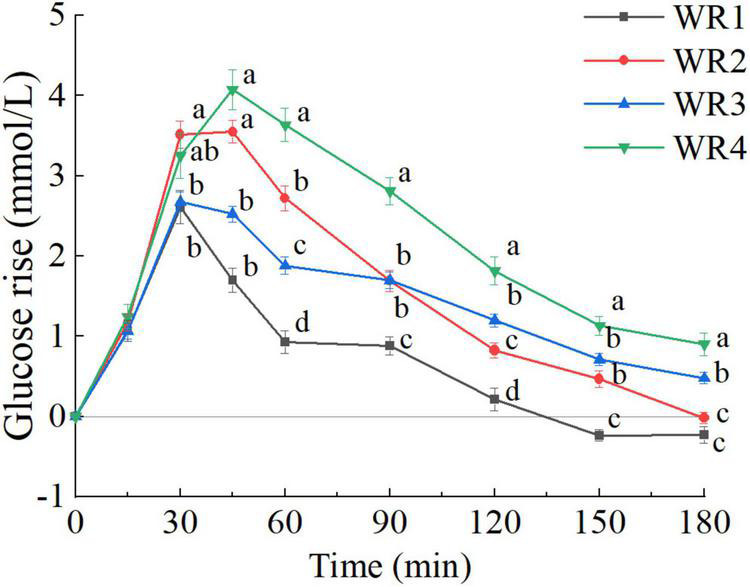
More distinct differences were found in glycemic parameters calculated over 180 min compared with that calculated over 120 min, especially in the negative area under the curve and Nadir. We identified four distinct PGR patterns to WR (WR1, WR2, WR3, and WR4) and G (G1, G2, G3, and G4), respectively. There were significant differences among the patterns regard to postprandial hyperglycemia, hypoglycemic, and glycemic variability. The WR1 clusters had significantly lower glycemic index (59 ± 19), while no difference was found among the glycemic index based on the other three clusters. Each given G subgroup presented multiple patterns of PGR to WR, especially in the largest G subgroup (G1), and in subgroup with the greatest glycemic variability (G3).
Multiple subgroups could be classified based on the PGR patterns to white rice and glucose even in seemingly homogeneous subjects. Extending the monitoring time to 180 min was conducive to more effective discrimination of PGR patterns. It may not be reliable to extrapolate the patterns of PGR to rice from that to glucose, suggesting a need of combining OGTT and meal tolerance test for individualized glycemic management.
有报道称,餐后血糖反应(PGR)对白米饭的人际差异很大,并且口服葡萄糖耐量试验(OGTT)期间的PGR模式差异已有记录。然而,关于白米饭的PGR模式的研究很少。我们研究了白米饭和葡萄糖的典型PGR模式以及它们之间的关联。
我们分析了114名年龄、体重状况相似且为同一族群的血糖正常女性受试者对白米饭(WR)和葡萄糖(G)的3小时PGR数据。基于离散血糖值计算了120分钟和180分钟内的多种血糖参数。应用基于180分钟内计算的血糖参数的K均值聚类来识别亚组和代表性PGR模式。基于聚类分析中使用的参数进行主因子分析以表征PGR模式。对白米饭和葡萄糖的聚类类别进行简单对应分析。
与120分钟时计算的血糖参数相比,180分钟时计算的血糖参数差异更明显,尤其是曲线下负面积和最低点。我们分别确定了对白米饭(WR1、WR2、WR3和WR4)和葡萄糖(G1、G2、G3和G4)的四种不同的PGR模式。这些模式在餐后高血糖、低血糖和血糖变异性方面存在显著差异。WR1聚类的血糖指数显著较低(59±19),而基于其他三个聚类的血糖指数没有差异。每个给定的G亚组呈现出对白米饭的多种PGR模式,尤其是在最大的G亚组(G1)和血糖变异性最大的亚组(G3)中。
即使在看似同质的受试者中,也可以根据对白米饭和葡萄糖的PGR模式将其分为多个亚组。将监测时间延长至180分钟有助于更有效地区分PGR模式。从葡萄糖的PGR模式推断米饭的PGR模式可能不可靠,这表明需要结合OGTT和餐耐量试验进行个体化血糖管理。