• 文献检索
  • 文档翻译
  • 深度研究
  • 学术资讯
  • Suppr Zotero 插件Zotero 插件
  • 邀请有礼
  • 套餐&价格
  • 历史记录
应用&插件
Suppr Zotero 插件Zotero 插件浏览器插件Mac 客户端Windows 客户端微信小程序
定价
高级版会员购买积分包购买API积分包
服务
文献检索文档翻译深度研究API 文档MCP 服务
关于我们
关于 Suppr公司介绍联系我们用户协议隐私条款
关注我们

Suppr 超能文献

核心技术专利:CN118964589B侵权必究
粤ICP备2023148730 号-1Suppr @ 2026

文献检索

告别复杂PubMed语法,用中文像聊天一样搜索,搜遍4000万医学文献。AI智能推荐,让科研检索更轻松。

立即免费搜索

文件翻译

保留排版,准确专业,支持PDF/Word/PPT等文件格式,支持 12+语言互译。

免费翻译文档

深度研究

AI帮你快速写综述,25分钟生成高质量综述,智能提取关键信息,辅助科研写作。

立即免费体验

针对不断演变的大流行的适应性指标:一种针对地区层面新冠疫情风险指定的动态方法。

Adaptive metrics for an evolving pandemic A dynamic approach to area-level COVID-19 risk designations.

作者信息

Bilinski Alyssa M, Salomon Joshua A, Hatfield Laura A

机构信息

Departments of Health Services, Policy and Practice & Biostatistics, Brown University, 121 S. Main St., Providence, RI 02912 USA.

Department of Health Policy, Stanford University, Stanford, CA 94305 USA.

出版信息

medRxiv. 2023 Feb 16:2023.02.15.23285969. doi: 10.1101/2023.02.15.23285969.

DOI:10.1101/2023.02.15.23285969
PMID:36824769
原文链接:https://pmc.ncbi.nlm.nih.gov/articles/PMC9949193/
Abstract

UNLABELLED

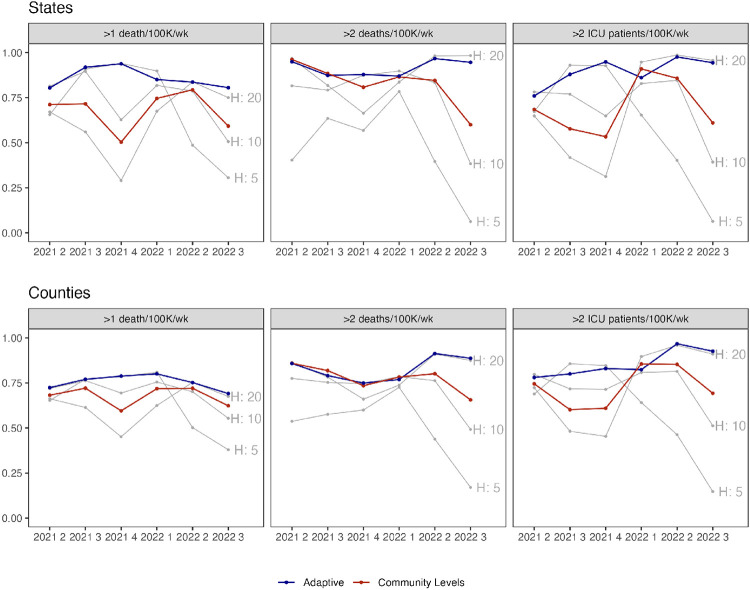
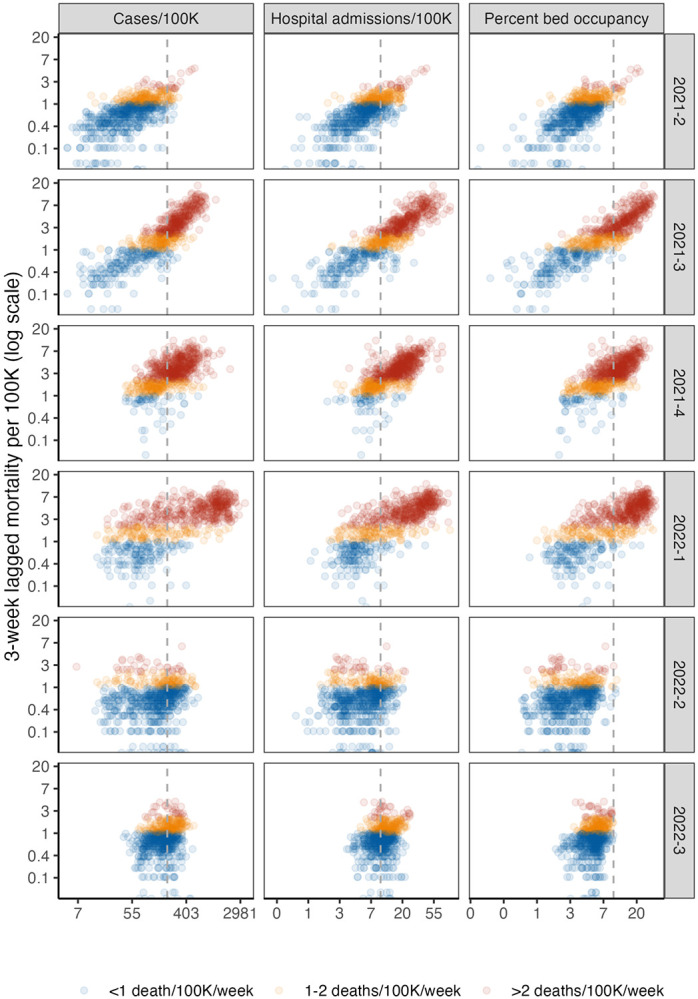
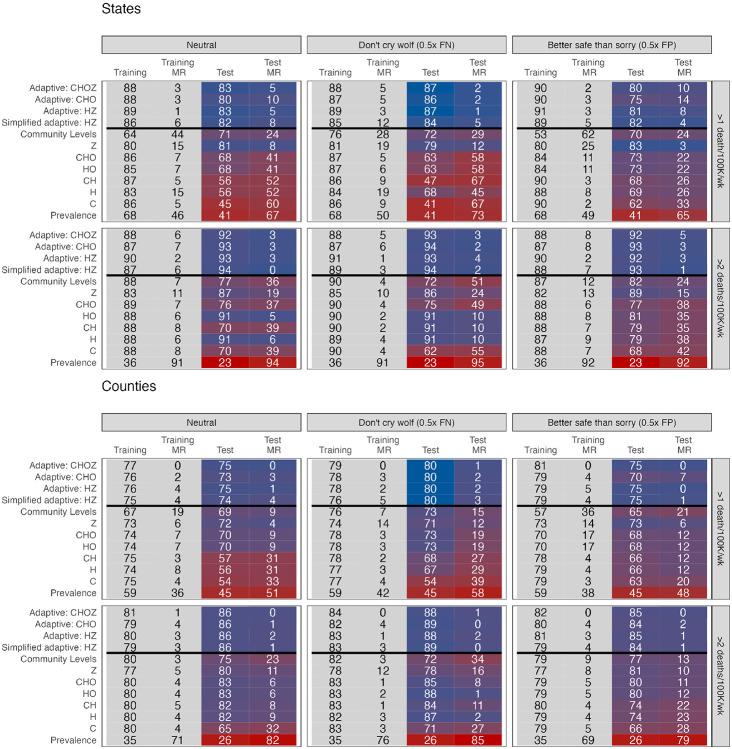
Throughout the COVID-19 pandemic, policymakers have proposed risk metrics, such as the CDC Community Levels, to guide local and state decision-making. However, risk metrics have not reliably predicted key outcomes and often lack transparency in terms of prioritization of false positive versus false negative signals. They have also struggled to maintain relevance over time due to slow and infrequent updates addressing new variants and shifts in vaccine- and infection-induced immunity. We make two contributions to address these weaknesses of risk metrics. We first present a framework to evaluate predictive accuracy based on policy targets related to severe disease and mortality, allowing for explicit preferences toward false negative versus false positive signals. This approach allows policymakers to optimize metrics for specific preferences and interventions. Second, we propose a novel method to update risk thresholds in real-time. We show that this adaptive approach to designating areas as "high risk" improves performance over static metrics in predicting 3-week-ahead mortality and intensive care usage at both state and county levels. We also demonstrate that with our approach, using only new hospital admissions to predict 3-week-ahead mortality and intensive care usage has performed consistently as well as metrics that also include cases and inpatient bed usage. Our results highlight that a key challenge for COVID-19 risk prediction is the changing relationship between indicators and outcomes of policy interest. Adaptive metrics therefore have a unique advantage in a rapidly evolving pandemic context.

SIGNIFICANCE STATEMENT

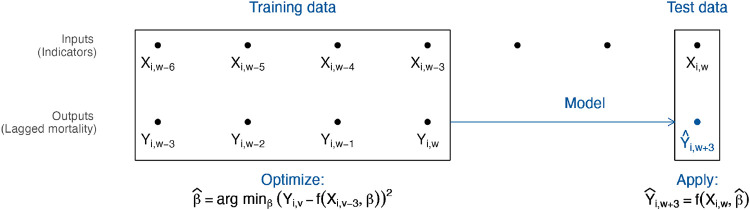
In the rapidly-evolving COVID-19 pandemic, public health risk metrics often become less relevant over time. Risk metrics are designed to predict future severe disease and mortality based on currently-available surveillance data, such as cases and hospitalizations. However, the relationship between cases, hospitalizations, and mortality has varied considerably over the course of the pandemic, in the context of new variants and shifts in vaccine- and infection-induced immunity. We propose an adaptive approach that regularly updates metrics based on the relationship between surveillance inputs and future outcomes of policy interest. Our method captures changing pandemic dynamics, requires only hospitalization input data, and outperforms static risk metrics in predicting high-risk states and counties.

摘要

未标注

在整个新冠疫情期间,政策制定者提出了风险指标,如美国疾病控制与预防中心(CDC)的社区风险等级,以指导地方和州的决策。然而,风险指标并未可靠地预测关键结果,而且在假阳性信号与假阴性信号的优先级方面往往缺乏透明度。由于针对新变种以及疫苗和感染诱导免疫的变化进行更新的速度缓慢且不频繁,它们还难以长期保持相关性。我们针对风险指标的这些弱点做出了两项贡献。我们首先提出了一个基于与严重疾病和死亡率相关的政策目标来评估预测准确性的框架,允许对假阴性信号与假阳性信号有明确的偏好。这种方法使政策制定者能够针对特定偏好和干预措施优化指标。其次,我们提出了一种实时更新风险阈值的新方法。我们表明,这种将地区指定为“高风险”的自适应方法在预测州和县层面提前3周的死亡率和重症监护使用率方面比静态指标表现更好。我们还证明,采用我们的方法,仅使用新入院人数来预测提前3周的死亡率和重症监护使用率,其表现与同时包含病例数和住院床位使用率的指标一样稳定。我们的结果凸显出,新冠风险预测的一个关键挑战在于政策关注的指标与结果之间不断变化的关系。因此,在疫情迅速演变的背景下,自适应指标具有独特优势。

意义声明

在迅速演变的新冠疫情中,公共卫生风险指标往往会随着时间推移而变得相关性降低。风险指标旨在根据当前可用的监测数据(如病例数和住院人数)预测未来的严重疾病和死亡率。然而,在新变种以及疫苗和感染诱导免疫发生变化的背景下,病例数、住院人数和死亡率之间的关系在疫情过程中发生了很大变化。我们提出一种自适应方法,该方法根据监测输入与政策关注的未来结果之间的关系定期更新指标。我们的方法捕捉了不断变化的疫情动态,仅需要住院输入数据,并且在预测高风险州和县方面优于静态风险指标。

https://cdn.ncbi.nlm.nih.gov/pmc/blobs/f84a/9949193/c6e701fecd7f/nihpp-2023.02.15.23285969v1-f0004.jpg
https://cdn.ncbi.nlm.nih.gov/pmc/blobs/f84a/9949193/28f44b005de4/nihpp-2023.02.15.23285969v1-f0001.jpg
https://cdn.ncbi.nlm.nih.gov/pmc/blobs/f84a/9949193/0ea06b370909/nihpp-2023.02.15.23285969v1-f0002.jpg
https://cdn.ncbi.nlm.nih.gov/pmc/blobs/f84a/9949193/e290001a9fd8/nihpp-2023.02.15.23285969v1-f0003.jpg
https://cdn.ncbi.nlm.nih.gov/pmc/blobs/f84a/9949193/c6e701fecd7f/nihpp-2023.02.15.23285969v1-f0004.jpg

相似文献

1
Adaptive metrics for an evolving pandemic A dynamic approach to area-level COVID-19 risk designations.针对不断演变的大流行的适应性指标:一种针对地区层面新冠疫情风险指定的动态方法。
medRxiv. 2023 Feb 16:2023.02.15.23285969. doi: 10.1101/2023.02.15.23285969.
2
Adaptive metrics for an evolving pandemic: A dynamic approach to area-level COVID-19 risk designations.适应不断演变的大流行的指标:一种针对地区 COVID-19 风险指定的动态方法。
Proc Natl Acad Sci U S A. 2023 Aug 8;120(32):e2302528120. doi: 10.1073/pnas.2302528120. Epub 2023 Aug 1.
3
Evaluating the Performance of Centers for Disease Control and Prevention COVID-19 Community Levels as Leading Indicators of COVID-19 Mortality.评估疾病控制与预防中心(CDC)新冠病毒社区传播水平作为新冠病毒死亡率的领先指标的表现。
Ann Intern Med. 2022 Sep;175(9):1240-1249. doi: 10.7326/M22-0803. Epub 2022 Aug 2.
4
Surveillance Metrics of SARS-CoV-2 Transmission in Central Asia: Longitudinal Trend Analysis.中亚地区 SARS-CoV-2 传播的监测指标:纵向趋势分析。
J Med Internet Res. 2021 Feb 3;23(2):e25799. doi: 10.2196/25799.
5
Dynamic Public Health Surveillance to Track and Mitigate the US COVID-19 Epidemic: Longitudinal Trend Analysis Study.动态公共卫生监测以追踪和缓解美国新冠疫情:纵向趋势分析研究
J Med Internet Res. 2020 Dec 3;22(12):e24286. doi: 10.2196/24286.
6
Emerging Variants of SARS-CoV-2 and Novel Therapeutics Against Coronavirus (COVID-19)严重急性呼吸综合征冠状病毒2(SARS-CoV-2)的新变种及针对冠状病毒(COVID-19)的新型疗法
7
The future of Cochrane Neonatal.考克兰新生儿协作网的未来。
Early Hum Dev. 2020 Nov;150:105191. doi: 10.1016/j.earlhumdev.2020.105191. Epub 2020 Sep 12.
8
9
Folic acid supplementation and malaria susceptibility and severity among people taking antifolate antimalarial drugs in endemic areas.在流行地区,服用抗叶酸抗疟药物的人群中,叶酸补充剂与疟疾易感性和严重程度的关系。
Cochrane Database Syst Rev. 2022 Feb 1;2(2022):CD014217. doi: 10.1002/14651858.CD014217.
10
Dynamic Panel Data Modeling and Surveillance of COVID-19 in Metropolitan Areas in the United States: Longitudinal Trend Analysis.动态面板数据分析与美国大都市地区 COVID-19 的监测:纵向趋势分析。
J Med Internet Res. 2021 Feb 9;23(2):e26081. doi: 10.2196/26081.

本文引用的文献

1
Using digital traces to build prospective and real-time county-level early warning systems to anticipate COVID-19 outbreaks in the United States.利用数字痕迹建立前瞻性和实时的县级预警系统,以预测美国 COVID-19 疫情的爆发。
Sci Adv. 2023 Jan 18;9(3):eabq0199. doi: 10.1126/sciadv.abq0199.
2
Evaluating the Performance of Centers for Disease Control and Prevention COVID-19 Community Levels as Leading Indicators of COVID-19 Mortality.评估疾病控制与预防中心(CDC)新冠病毒社区传播水平作为新冠病毒死亡率的领先指标的表现。
Ann Intern Med. 2022 Sep;175(9):1240-1249. doi: 10.7326/M22-0803. Epub 2022 Aug 2.
3
Comparing trained and untrained probabilistic ensemble forecasts of COVID-19 cases and deaths in the United States.
比较美国新冠病例和死亡的经过训练与未经训练的概率集合预测。
Int J Forecast. 2023 Jul-Sep;39(3):1366-1383. doi: 10.1016/j.ijforecast.2022.06.005. Epub 2022 Jul 1.
4
Use of At-Home COVID-19 Tests - United States, August 23, 2021-March 12, 2022.家庭版 COVID-19 检测的使用情况-美国,2021 年 8 月 23 日-2022 年 3 月 12 日。
MMWR Morb Mortal Wkly Rep. 2022 Apr 1;71(13):489-494. doi: 10.15585/mmwr.mm7113e1.
5
Real-time pandemic surveillance using hospital admissions and mobility data.利用医院就诊数据和移动出行数据进行实时疫情监测。
Proc Natl Acad Sci U S A. 2022 Feb 15;119(7). doi: 10.1073/pnas.2111870119.
6
A National Strategy for the "New Normal" of Life With COVID.应对新冠疫情下“新常态”生活的国家战略。
JAMA. 2022 Jan 18;327(3):211-212. doi: 10.1001/jama.2021.24282.
7
Can auxiliary indicators improve COVID-19 forecasting and hotspot prediction?辅助指标能否提高 COVID-19 的预测和热点预测?
Proc Natl Acad Sci U S A. 2021 Dec 21;118(51). doi: 10.1073/pnas.2111453118.
8
An open repository of real-time COVID-19 indicators.实时 COVID-19 指标开放知识库。
Proc Natl Acad Sci U S A. 2021 Dec 21;118(51). doi: 10.1073/pnas.2111452118.
9
Assessment of event-triggered policies of nonpharmaceutical interventions based on epidemiological indicators.基于流行病学指标的非药物干预事件触发政策评估。
J Math Biol. 2021 Sep 25;83(4):42. doi: 10.1007/s00285-021-01669-0.
10
An early warning approach to monitor COVID-19 activity with multiple digital traces in near real time.一种利用多个数字痕迹进行近实时监测 COVID-19 活动的早期预警方法。
Sci Adv. 2021 Mar 5;7(10). doi: 10.1126/sciadv.abd6989. Print 2021 Mar.