• 文献检索
  • 文档翻译
  • 深度研究
  • 学术资讯
  • Suppr Zotero 插件Zotero 插件
  • 邀请有礼
  • 套餐&价格
  • 历史记录
应用&插件
Suppr Zotero 插件Zotero 插件浏览器插件Mac 客户端Windows 客户端微信小程序
定价
高级版会员购买积分包购买API积分包
服务
文献检索文档翻译深度研究API 文档MCP 服务
关于我们
关于 Suppr公司介绍联系我们用户协议隐私条款
关注我们

Suppr 超能文献

核心技术专利:CN118964589B侵权必究
粤ICP备2023148730 号-1Suppr @ 2026

文献检索

告别复杂PubMed语法,用中文像聊天一样搜索,搜遍4000万医学文献。AI智能推荐,让科研检索更轻松。

立即免费搜索

文件翻译

保留排版,准确专业,支持PDF/Word/PPT等文件格式,支持 12+语言互译。

免费翻译文档

深度研究

AI帮你快速写综述,25分钟生成高质量综述,智能提取关键信息,辅助科研写作。

立即免费体验

通过利用机器学习和调查绘制多源用水情况并剖析地理不平等现象,加强用水监测。

Enhancing water access monitoring through mapping multi-source usage and disaggregated geographic inequalities with machine learning and surveys.

作者信息

Geleijnse Jan, Rutten Martine, de Villiers Didier, Bamwenda James Tayebwa, Abraham Edo

机构信息

Department of Water Management, Delft University of Technology, Mekelweg, 2628 CD, Delft, The Netherlands.

UNICEF, Nairobi, Kenya.

出版信息

Sci Rep. 2023 Aug 18;13(1):13433. doi: 10.1038/s41598-023-39917-6.

DOI:10.1038/s41598-023-39917-6
PMID:37596313
原文链接:https://pmc.ncbi.nlm.nih.gov/articles/PMC10439218/
Abstract

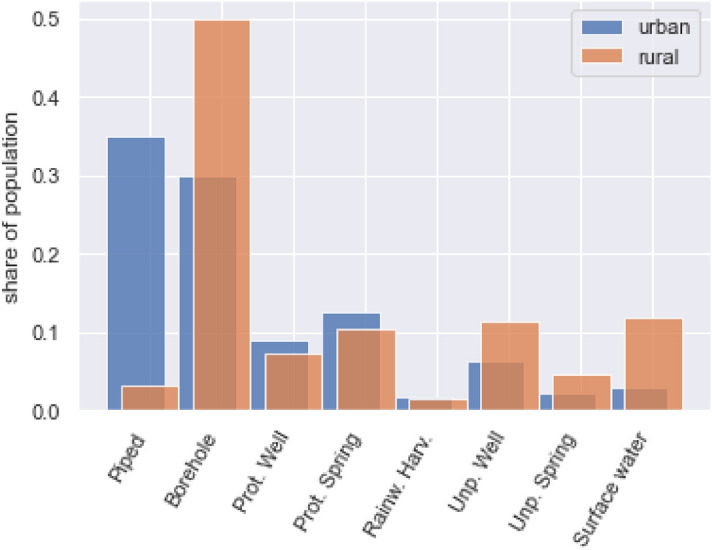
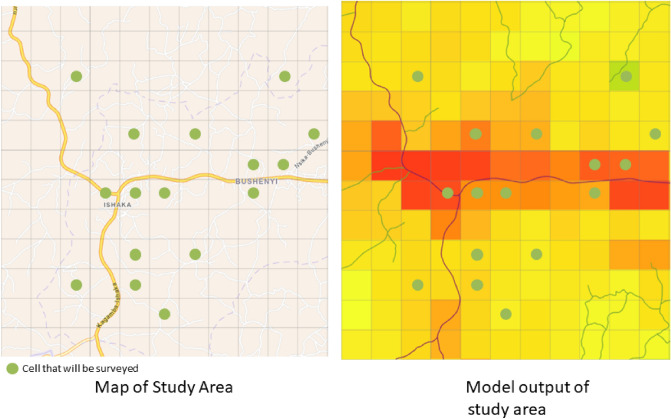
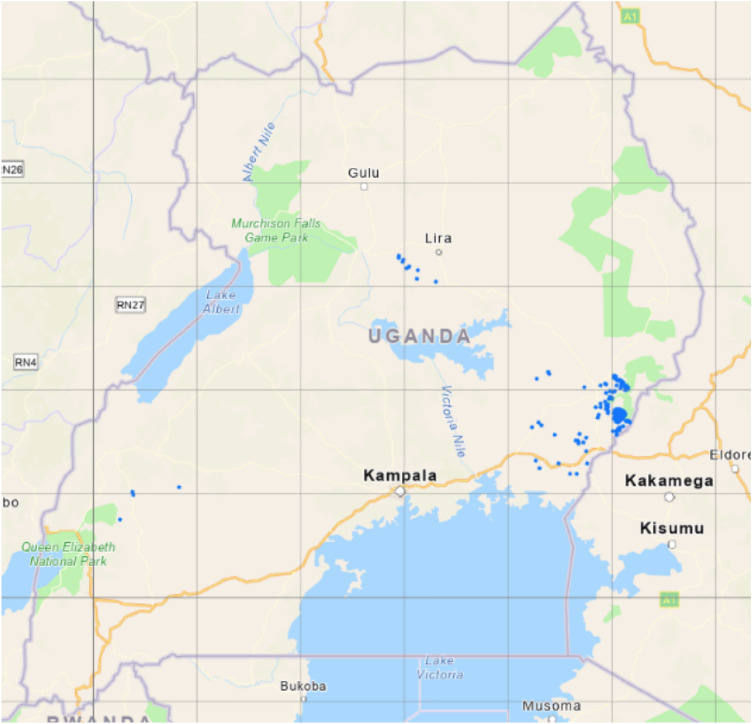
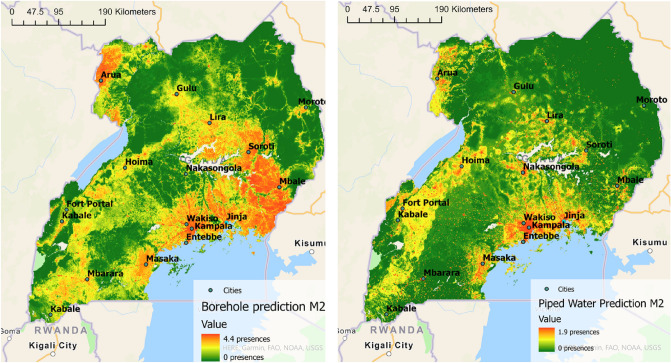
Monitoring safe water access in developing countries relies primarily on household health survey and census data. These surveys are often incomplete: they tend to focus on the primary water source only, are spatially coarse, and usually happen every 5-10 years, during which significant changes can happen in urbanisation and infrastructure provision, especially in sub Saharan Africa. In this work, we present a data-driven approach that utilises and compliments survey based data of water access, to provide context-specific and disaggregated monitoring. The level of access to improved water and sanitation has been shown to vary with geographical inequalities related to the availability of water resources and terrain, population density and socio-economic determinants such as income and education. We use such data and successfully predict the level of water access in areas for which data is lacking, providing spatially explicit and community level monitoring possibilities for mapping geographical inequalities in access. This is showcased by applying three machine learning models that use such geographical data to predict the number of presences of water access points of eight different access types across Uganda, with a 1km by 1km grid resolution. Two Multi-Layer-Perceptron (MLP) models and a Maximum Entropy (MaxEnt) model are developed and compared, where the former are shown to consistently outperform the latter. The best performing Neural Network model achieved a True Positive Rate of 0.89 and a False Positive Rate of 0.24, compared to 0.85 and 0.46 respectively for the MaxEnt model. The models improve on previous work on water point modeling through the use of neural networks, in addition to introducing the True Positive - and False Positive Rate as better evaluation metrics to also assess the MaxEnt model. We also present a scaling method to move from predicting only the relative probability of water point presences, to predicting the absolute number of presences. To challenge both the model results and the more standard health surveys, a new household level survey is carried out in Bushenyi, a mid-sized town in the South-West of Uganda, asking specifically about the multitude of water sources. On average Bushenyi households reported to use 1.9 water sources. The survey further showed that the actual presence of a source, does not always imply that it is used. Therefore it is no option to rely solely on models for water access monitoring. For this, household surveys remain necessary but should be extended with questions on the multiple sources that are used by households.

摘要

在发展中国家,监测安全用水获取情况主要依赖于家庭健康调查和人口普查数据。这些调查往往并不完整:它们往往仅关注主要水源,空间分辨率较低,且通常每5至10年进行一次,在此期间,城市化和基础设施建设可能会发生重大变化,尤其是在撒哈拉以南非洲地区。在这项工作中,我们提出了一种数据驱动的方法,该方法利用并补充基于调查的用水获取数据,以提供特定背景下的分类监测。改善水和卫生设施的获取水平已被证明会因与水资源可用性、地形、人口密度以及收入和教育等社会经济决定因素相关的地理不平等而有所不同。我们利用这些数据成功预测了缺乏数据地区的用水获取水平,为绘制获取方面的地理不平等提供了空间明确且社区层面的监测可能性。这通过应用三种机器学习模型得以展示,这些模型利用此类地理数据预测乌干达各地八种不同获取类型的取水点存在数量,网格分辨率为1公里×1公里。开发并比较了两个多层感知器(MLP)模型和一个最大熵(MaxEnt)模型,结果表明前两者始终优于后者。表现最佳的神经网络模型的真阳性率为0.89,假阳性率为0.24,而MaxEnt模型的真阳性率和假阳性率分别为0.85和0.46。这些模型除了引入真阳性率和假阳性率作为更好的评估指标来评估MaxEnt模型外,还通过使用神经网络改进了先前关于取水点建模的工作。我们还提出了一种缩放方法,从仅预测取水点存在的相对概率转变为预测存在的绝对数量。为了检验模型结果以及更标准的健康调查,在乌干达西南部的一个中型城镇布申伊开展了一项新的家庭层面调查,特别询问了多种水源的情况。布申伊家庭平均报告使用1.9个水源。该调查进一步表明,水源的实际存在并不总是意味着它被使用。因此,不能仅依靠模型进行用水获取监测。为此,家庭调查仍然必要,但应扩展关于家庭使用的多种水源的问题。

https://cdn.ncbi.nlm.nih.gov/pmc/blobs/c9ed/10439218/4932fa261c28/41598_2023_39917_Fig11_HTML.jpg
https://cdn.ncbi.nlm.nih.gov/pmc/blobs/c9ed/10439218/fb83432be280/41598_2023_39917_Fig1_HTML.jpg
https://cdn.ncbi.nlm.nih.gov/pmc/blobs/c9ed/10439218/1ec9846c2117/41598_2023_39917_Fig2_HTML.jpg
https://cdn.ncbi.nlm.nih.gov/pmc/blobs/c9ed/10439218/f2262163d0f7/41598_2023_39917_Fig3_HTML.jpg
https://cdn.ncbi.nlm.nih.gov/pmc/blobs/c9ed/10439218/62887655b41e/41598_2023_39917_Fig4_HTML.jpg
https://cdn.ncbi.nlm.nih.gov/pmc/blobs/c9ed/10439218/8a23d8e636a2/41598_2023_39917_Fig5_HTML.jpg
https://cdn.ncbi.nlm.nih.gov/pmc/blobs/c9ed/10439218/bcbfc7fdf11c/41598_2023_39917_Fig6_HTML.jpg
https://cdn.ncbi.nlm.nih.gov/pmc/blobs/c9ed/10439218/8a2ecf5e1b81/41598_2023_39917_Fig7_HTML.jpg
https://cdn.ncbi.nlm.nih.gov/pmc/blobs/c9ed/10439218/30de10f9e6c4/41598_2023_39917_Fig8_HTML.jpg
https://cdn.ncbi.nlm.nih.gov/pmc/blobs/c9ed/10439218/e4af8d89bdc7/41598_2023_39917_Fig9_HTML.jpg
https://cdn.ncbi.nlm.nih.gov/pmc/blobs/c9ed/10439218/f847a25b83c2/41598_2023_39917_Fig10_HTML.jpg
https://cdn.ncbi.nlm.nih.gov/pmc/blobs/c9ed/10439218/4932fa261c28/41598_2023_39917_Fig11_HTML.jpg

相似文献

1
Enhancing water access monitoring through mapping multi-source usage and disaggregated geographic inequalities with machine learning and surveys.通过利用机器学习和调查绘制多源用水情况并剖析地理不平等现象,加强用水监测。
Sci Rep. 2023 Aug 18;13(1):13433. doi: 10.1038/s41598-023-39917-6.
2
Geographical inequalities in use of improved drinking water supply and sanitation across Sub-Saharan Africa: mapping and spatial analysis of cross-sectional survey data.撒哈拉以南非洲地区在改善饮用水供应和卫生设施方面的地域不平等:基于横断面调查数据的制图和空间分析。
PLoS Med. 2014 Apr 8;11(4):e1001626. doi: 10.1371/journal.pmed.1001626. eCollection 2014 Apr.
3
Folic acid supplementation and malaria susceptibility and severity among people taking antifolate antimalarial drugs in endemic areas.在流行地区,服用抗叶酸抗疟药物的人群中,叶酸补充剂与疟疾易感性和严重程度的关系。
Cochrane Database Syst Rev. 2022 Feb 1;2(2022):CD014217. doi: 10.1002/14651858.CD014217.
4
Mapping access to domestic water supplies from incomplete data in developing countries: An illustrative assessment for Kenya.从发展中国家不完整的数据中绘制获取家庭供水的情况:肯尼亚的说明性评估。
PLoS One. 2019 May 17;14(5):e0216923. doi: 10.1371/journal.pone.0216923. eCollection 2019.
5
A cross-sectional ecological study of spatial scale and geographic inequality in access to drinking-water and sanitation.一项关于饮用水和卫生设施获取方面空间尺度与地理不平等的横断面生态研究。
Int J Equity Health. 2014 Nov 26;13:113. doi: 10.1186/s12939-014-0113-3.
6
Addressing diarrhea prevalence in the West African Middle Belt: social and geographic dimensions in a case study for Benin.解决西非中部地区的腹泻流行问题:以贝宁为例的社会和地理维度分析
Int J Health Geogr. 2008 Apr 23;7:17. doi: 10.1186/1476-072X-7-17.
7
Exploring geographical variations and inequalities in access to improved water and sanitation in Ethiopia: mapping and spatial analysis.探索埃塞俄比亚在获取改善的水和卫生设施方面的地理差异与不平等:绘图与空间分析
Heliyon. 2020 Apr 30;6(4):e03828. doi: 10.1016/j.heliyon.2020.e03828. eCollection 2020 Apr.
8
Household trends in access to improved water sources and sanitation facilities in Vietnam and associated factors: findings from the Multiple Indicator Cluster Surveys, 2000-2011.越南家庭获取改善水源和卫生设施的趋势及相关因素:2000 - 2011年多指标类集调查结果
Glob Health Action. 2016 Feb 29;9:29434. doi: 10.3402/gha.v9.29434. eCollection 2016.
9
Effects of household access to water, sanitation, and hygiene services on under-five mortality in Sub-Saharan Africa.撒哈拉以南非洲地区家庭获得水、环境卫生和个人卫生服务对五岁以下儿童死亡率的影响。
Front Public Health. 2023 Apr 27;11:1136299. doi: 10.3389/fpubh.2023.1136299. eCollection 2023.
10
Access to water and sanitation among people with disabilities: results from cross-sectional surveys in Bangladesh, Cameroon, India and Malawi.残疾人的水和卫生设施获取情况:孟加拉国、喀麦隆、印度和马拉维横断面调查结果
BMJ Open. 2018 Jun 4;8(6):e020077. doi: 10.1136/bmjopen-2017-020077.

本文引用的文献

1
Mapping geographical inequalities in access to drinking water and sanitation facilities in low-income and middle-income countries, 2000-17.绘制 2000-2017 年中低收入国家获取饮用水和卫生设施服务的地理不平等情况图。
Lancet Glob Health. 2020 Sep;8(9):e1162-e1185. doi: 10.1016/S2214-109X(20)30278-3.
2
Mapping access to domestic water supplies from incomplete data in developing countries: An illustrative assessment for Kenya.从发展中国家不完整的数据中绘制获取家庭供水的情况:肯尼亚的说明性评估。
PLoS One. 2019 May 17;14(5):e0216923. doi: 10.1371/journal.pone.0216923. eCollection 2019.
3
Urban growth and water access in sub-Saharan Africa: Progress, challenges, and emerging research directions.
撒哈拉以南非洲的城市增长与水供应:进展、挑战与新兴研究方向。
Sci Total Environ. 2017 Dec 31;607-608:497-508. doi: 10.1016/j.scitotenv.2017.06.157. Epub 2017 Jul 27.
4
Integration of population census and water point mapping data-A case study of Cambodia, Liberia and Tanzania.人口普查与取水点测绘数据整合——柬埔寨、利比里亚和坦桑尼亚的案例研究
Int J Hyg Environ Health. 2017 Jul;220(5):888-899. doi: 10.1016/j.ijheh.2017.04.006. Epub 2017 May 4.
5
Global monitoring of water supply and sanitation: history, methods and future challenges.全球供水与卫生监测:历史、方法及未来挑战
Int J Environ Res Public Health. 2014 Aug 11;11(8):8137-65. doi: 10.3390/ijerph110808137.
6
Mapping species distributions with MAXENT using a geographically biased sample of presence data: a performance assessment of methods for correcting sampling bias.使用存在数据的地理偏差样本,通过最大熵模型(MAXENT)绘制物种分布:校正采样偏差方法的性能评估
PLoS One. 2014 May 12;9(5):e97122. doi: 10.1371/journal.pone.0097122. eCollection 2014.
7
Geographical inequalities in use of improved drinking water supply and sanitation across Sub-Saharan Africa: mapping and spatial analysis of cross-sectional survey data.撒哈拉以南非洲地区在改善饮用水供应和卫生设施方面的地域不平等:基于横断面调查数据的制图和空间分析。
PLoS Med. 2014 Apr 8;11(4):e1001626. doi: 10.1371/journal.pmed.1001626. eCollection 2014 Apr.
8
System dynamics modeling for municipal water demand estimation in an urban region under uncertain economic impacts.在经济影响不确定的情况下,对城市区域的城市需水量进行系统动力学建模。
J Environ Manage. 2011 Jun;92(6):1628-41. doi: 10.1016/j.jenvman.2011.01.020. Epub 2011 Feb 15.