Fortin J M, Hirota L K, Bond B E, O'Connor A M, Col N F
Decision Systems Group, Brigham and Women's Hospital, Harvard Medical School, Boston, Massachusetts, USA.
BMC Med Inform Decis Mak. 2001;1:2. doi: 10.1186/1472-6947-1-2. Epub 2001 Aug 1.
Patients increasingly seek more active involvement in health care decisions, but little is known about how to communicate complex risk information to patients. The objective of this study was to elicit patient preferences for the presentation and framing of complex risk information.
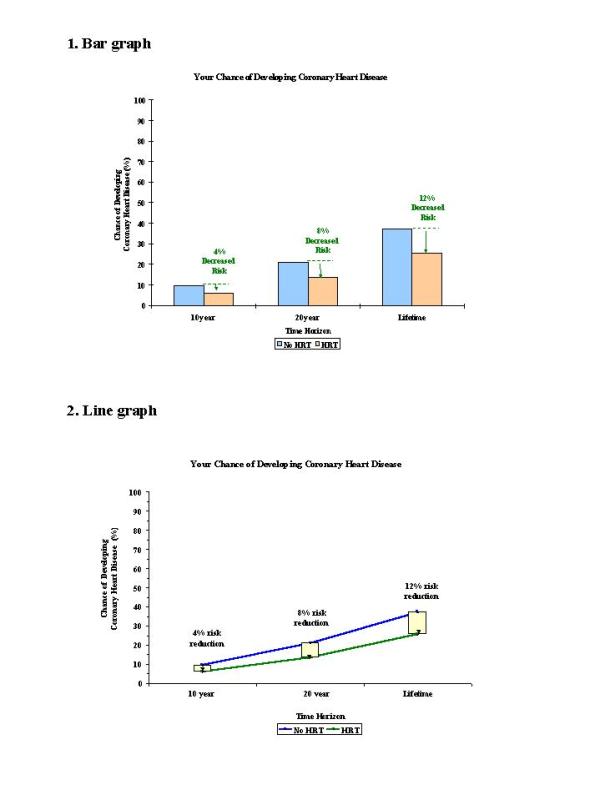
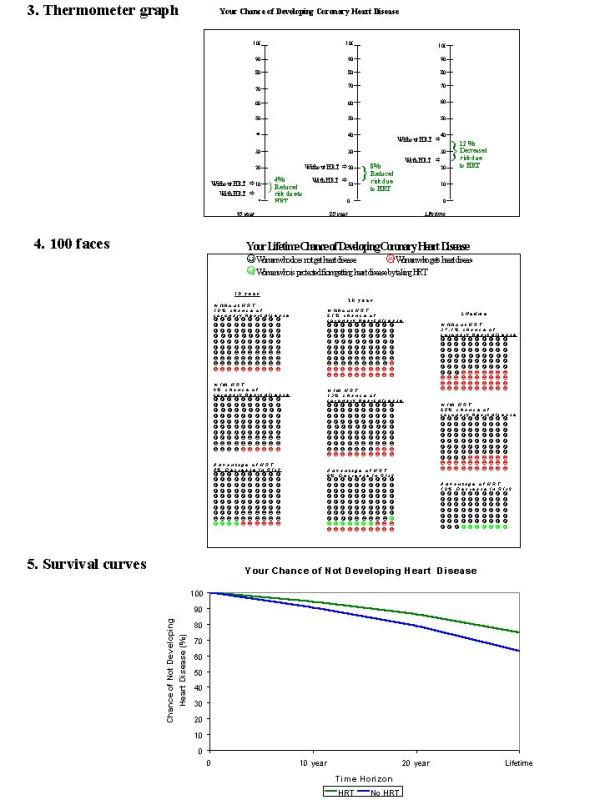
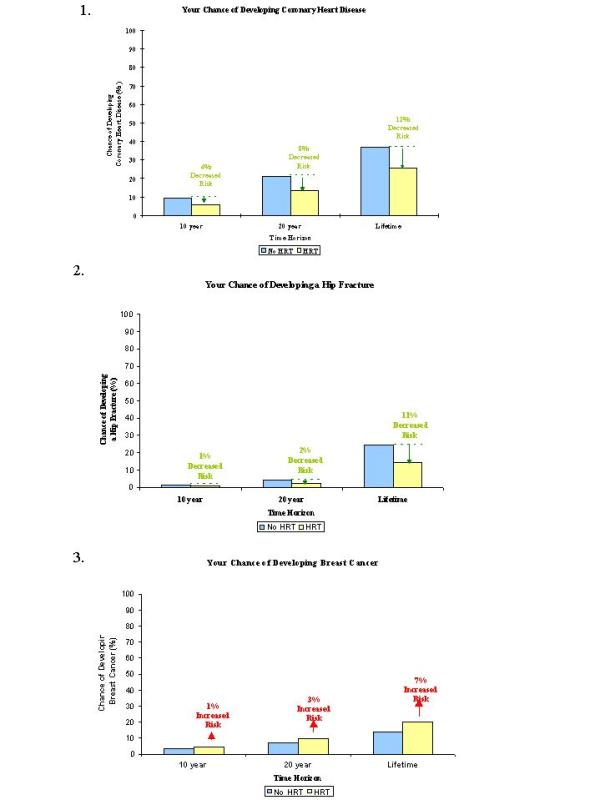
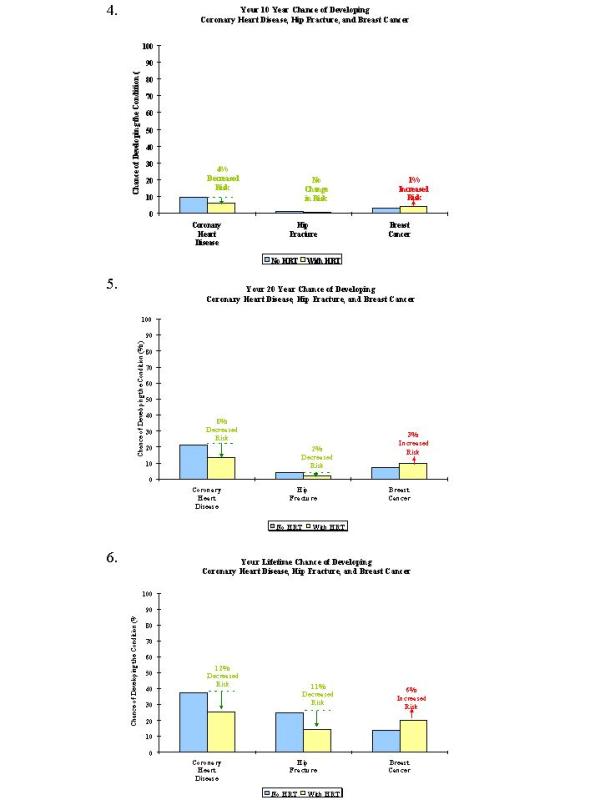
To accomplish this, eight focus group discussions and 15 one-on-one interviews were conducted, where women were presented with risk data in a variety of different graphical formats, metrics, and time horizons. Risk data were based on a hypothetical woman's risk for coronary heart disease, hip fracture, and breast cancer, with and without hormone replacement therapy. Participants' preferences were assessed using likert scales, ranking, and abstractions of focus group discussions.
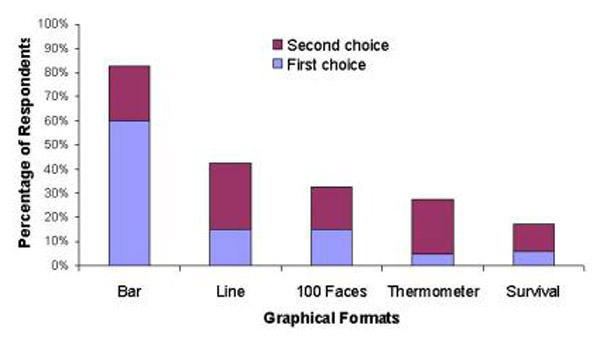
Forty peri- and postmenopausal women were recruited through hospital fliers (n = 25) and a community health fair (n = 15). Mean age was 51 years, 50% were non-Caucasian, and all had completed high school. Bar graphs were preferred by 83% of participants over line graphs, thermometer graphs, 100 representative faces, and survival curves. Lifetime risk estimates were preferred over 10 or 20-year horizons, and absolute risks were preferred over relative risks and number needed to treat.
Although there are many different formats for presenting and framing risk information, simple bar charts depicting absolute lifetime risk were rated and ranked highest overall for patient preferences for format.
患者越来越希望更积极地参与医疗保健决策,但对于如何向患者传达复杂的风险信息却知之甚少。本研究的目的是了解患者对复杂风险信息呈现方式和框架的偏好。
为实现这一目标,进行了八次焦点小组讨论和十五次一对一访谈,向女性展示了各种不同图形格式、指标和时间范围的风险数据。风险数据基于一名假设女性患冠心病、髋部骨折和乳腺癌的风险,包括使用和不使用激素替代疗法的情况。使用李克特量表、排序以及焦点小组讨论的摘要来评估参与者的偏好。
通过医院传单(n = 25)和社区健康博览会(n = 15)招募了40名围绝经期和绝经后女性。平均年龄为51岁,50%为非白种人,且均完成了高中学业。83%的参与者更喜欢柱状图,而不是折线图、温度计图、100张代表性面孔和生存曲线。与10年或20年的时间范围相比,参与者更喜欢终身风险估计,与相对风险和治疗所需人数相比,更喜欢绝对风险。
尽管有许多不同的风险信息呈现方式和框架,但对于患者对格式的偏好而言,描绘绝对终身风险的简单柱状图总体评分和排名最高。