National Center for Environmental Health, Centers for Disease Control and Prevention, Atlanta, Georgia, USA.
Int J Health Geogr. 2012 Jan 12;11:3. doi: 10.1186/1476-072X-11-3.
Progress has been made recently in estimating ambient PM(2.5) (particulate matter with aerodynamic diameter < 2.5 μm) and ozone concentrations using various data sources and advanced modeling techniques, which resulted in gridded surfaces. However, epidemiologic and health impact studies often require population exposures to ambient air pollutants to be presented at an appropriate census geographic unit (CGU), where health data are usually available to maintain confidentiality of individual health data. We aim to generate estimates of population exposures to ambient PM(2.5) and ozone for U.S. CGUs.
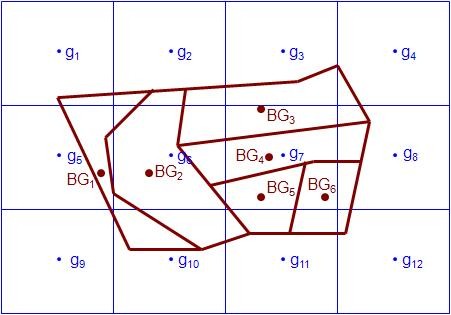
We converted 2001-2006 gridded data, generated by the U.S. Environmental Protection Agency (EPA) for CDC's (Centers for Disease Control and Prevention) Environmental Public Health Tracking Network (EPHTN), to census block group (BG) based on spatial proximities between BG and its four nearest grids. We used a bottom-up (fine to coarse) strategy to generate population exposure estimates for larger CGUs by aggregating BG estimates weighted by population distribution.
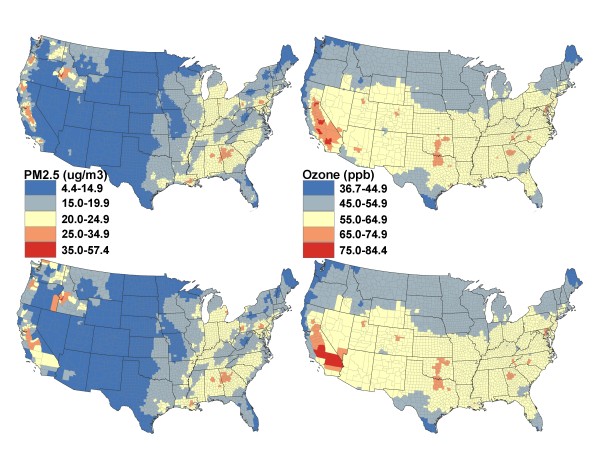
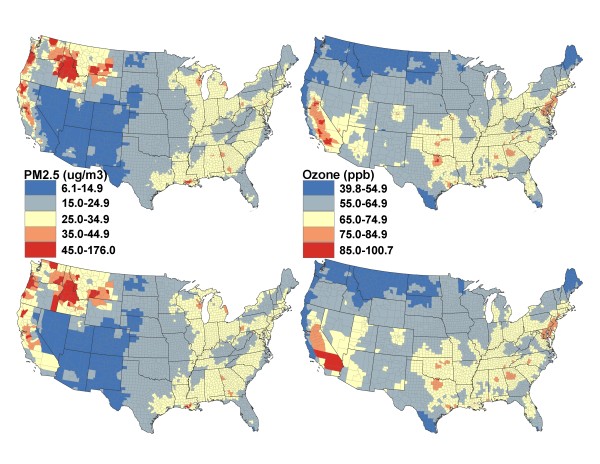
The BG daily estimates were comparable to monitoring data. On average, the estimates deviated by 2 μg/m(3) (for PM(2.5)) and 3 ppb (for ozone) from their corresponding observed values. Population exposures to ambient PM(2.5) and ozone varied greatly across the U.S. In 2006, estimates for daily potential population exposure to ambient PM(2.5) in west coast states, the northwest and a few areas in the east and estimates for daily potential population exposure to ambient ozone in most of California and a few areas in the east/southeast exceeded the National Ambient Air Quality Standards (NAAQS) for at least 7 days.
These estimates may be useful in assessing health impacts through linkage studies and in communicating with the public and policy makers for potential intervention.
最近,使用各种数据源和先进建模技术在估计环境 PM(2.5)(空气动力学直径<2.5μm 的颗粒物)和臭氧浓度方面取得了进展,从而产生了网格化表面。然而,流行病学和健康影响研究通常需要以适当的普查地理单位 (CGU) 呈现人群对环境空气污染物的暴露情况,而健康数据通常可在该单位获得,以维护个人健康数据的保密性。我们旨在生成美国 CGU 人群对环境 PM(2.5) 和臭氧的暴露估计值。
我们根据 BG 与四个最近的网格之间的空间接近度,将美国环境保护署 (EPA) 为疾病预防控制中心 (CDC) 的环境公共卫生追踪网络 (EPHTN) 生成的 2001-2006 年网格化数据转换为普查街区组 (BG)。我们使用自下而上(从细到粗)的策略,通过按人口分布加权 BG 估计值来生成较大 CGU 的人群暴露估计值。
BG 日估计值与监测数据相当。平均而言,估计值与相应的观测值相差 2μg/m(3)(PM(2.5))和 3ppb(臭氧)。美国各地的人群对环境 PM(2.5) 和臭氧的暴露量差异很大。2006 年,西海岸各州、西北部和东部的几个地区的每日潜在人群对环境 PM(2.5) 的暴露估计值以及加利福尼亚州大部分地区和东部/东南部的几个地区的每日潜在人群对环境臭氧的暴露估计值至少有 7 天超过了国家环境空气质量标准 (NAAQS)。
这些估计值可能有助于通过关联研究评估健康影响,并与公众和决策者就潜在干预措施进行沟通。