Henchoz Yves, Meylan Lionel, Santos-Eggimann Brigitte
Institute of Social and Preventive Medicine (IUMSP), University of Lausanne Hospital Centre, Route de la Corniche 10, CH-1010, Lausanne, Switzerland.
Health Qual Life Outcomes. 2016 Mar 11;14:41. doi: 10.1186/s12955-016-0443-5.
A single overall rating of quality of life (QoL) is a sensitive method that is often used in population surveys. However, the exact meaning of response choices is unclear. In particular, uneven spacing may affect the way QoL ratings should be analyzed and interpreted. This study aimed to determine the intervals between response choices to a single-item QoL assessment.
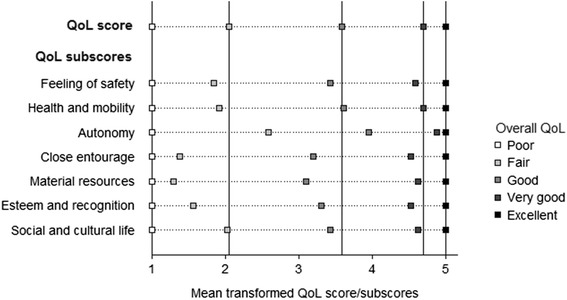
A secondary analysis was conducted on data from the Lc65+ cohort study and two additional, population-based, stratified random samples of older people (N = 5,300). Overall QoL was rated as excellent, very good, good, fair or poor. A QoL score (range 0-100) was derived from participants' answers to a 28-item QoL assessment tool. A transformed QoL score ranging from 1 (poor) to 5 (excellent) was calculated. The same procedure was repeated to compute seven domain-specific QoL subscores (Feeling of safety; Health and mobility; Autonomy; Close entourage; Material resources; Esteem and recognition; Social and cultural life).
Mean (95 % confidence intervals) QoL scores were 96.23 (95.81-96.65) for excellent, 93.09 (92.74-93.45) for very good, 81.45 (80.63-82.27) for good, 65.44 (62.67-68.20) for fair and 54.52 (45.31-63.73) for poor overall QoL, corresponding to transformed QoL scores of respectively 5.00, 4.70, 3.58, 2.05, and 1.00. Ordinality of the categories excellent to poor was preserved in all seven QoL subscores.
The excellent-to-poor rating scale provides an ordinal measure of overall QoL. The intervals between response choices are unequal, but an interval scale can be obtained after adequate recoding of excellent, very good, good, fair and poor.
单一的总体生活质量(QoL)评分是一种常用于人口调查的敏感方法。然而,回答选项的确切含义尚不清楚。特别是,间距不均可能会影响QoL评分的分析和解释方式。本研究旨在确定单项QoL评估中回答选项之间的区间。
对来自Lc65 +队列研究以及另外两个基于人群的老年人分层随机样本(N = 5300)的数据进行二次分析。总体生活质量被评为优秀、非常好、好、一般或差。生活质量得分(范围0 - 100)源自参与者对一个28项生活质量评估工具的回答。计算出一个从1(差)到5(优秀)的转换后生活质量得分。重复相同程序以计算七个特定领域的生活质量子得分(安全感;健康与 mobility;自主性;亲密随从;物质资源;尊重与认可;社会与文化生活)。
优秀的平均(95%置信区间)生活质量得分为96.23(95.81 - 96.65),非常好为93.09(92.74 - 93.45),好为81.45(80.63 - 82.27),一般为65.44(62.67 - 68.20),总体生活质量差为54.52(45.31 - 63.73),分别对应转换后的生活质量得分5.00、4.70、3.58、2.05和1.00。在所有七个生活质量子得分中,优秀到差类别的顺序性得以保留。
优秀到差的评分量表提供了总体生活质量的顺序测量。回答选项之间的区间不相等,但在对优秀、非常好、好、一般和差进行适当重新编码后可以获得区间量表。