Huff Andrew, Allen Toph, Whiting Karissa, Breit Nathan, Arnold Brock
Technology & Data Science, EcoHealth Alliance, New York, NY, USA.
PLoS Curr. 2016 Jun 10;8:ecurrents.outbreaks.711379ace737b7c04c89765342a9a8c9. doi: 10.1371/currents.outbreaks.711379ace737b7c04c89765342a9a8c9.
Beginning in 2015, Zika virus rapidly spread throughout the Americas and has been linked to neurological and autoimmune diseases in adults and babies. Developing accurate tools to anticipate Zika spread is one of the first steps to mitigate further spread of the disease. When combined, air traffic data and network simulations can be used to create tools to predict where infectious disease may spread to and aid in the prevention of infectious diseases. Specific goals were to: 1) predict where travelers infected with the Zika Virus would arrive in the U.S.; and, 2) analyze and validate the open access web application's (i.e., FLIRT) predictions using data collected after the prediction was made.
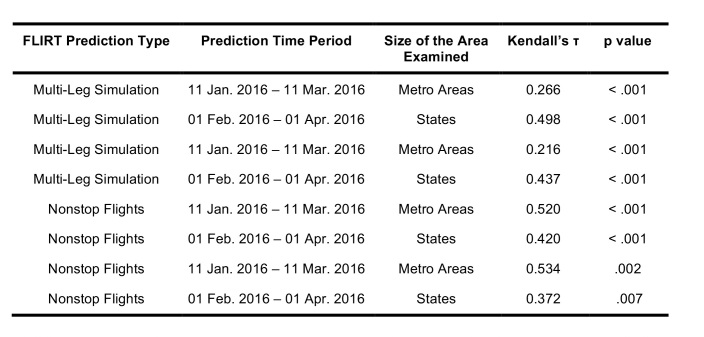
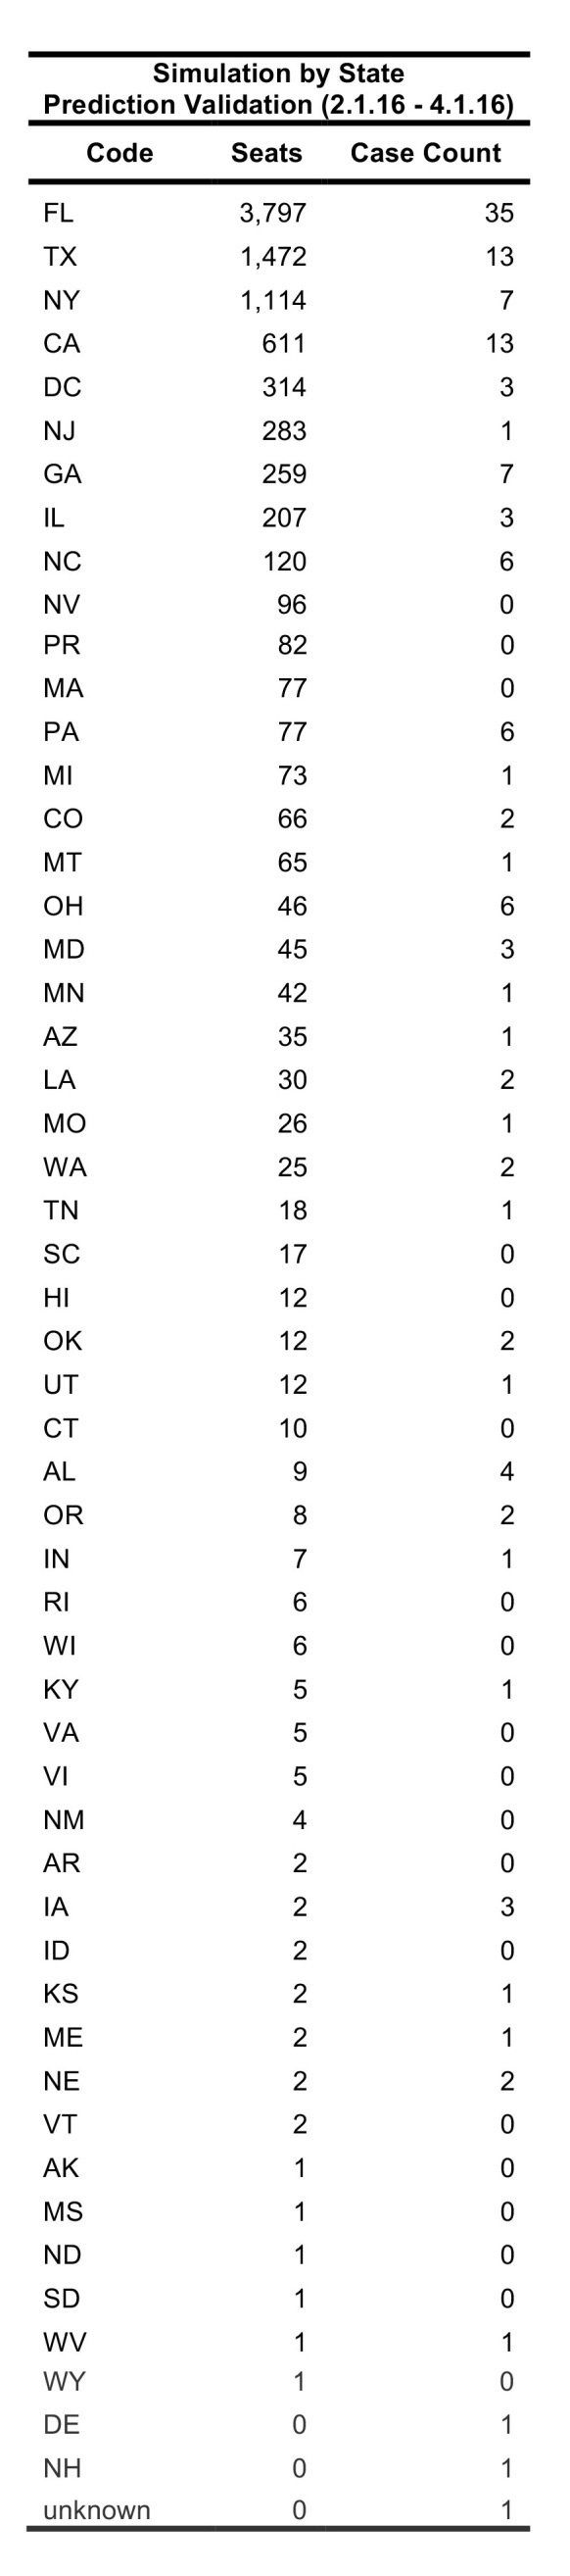
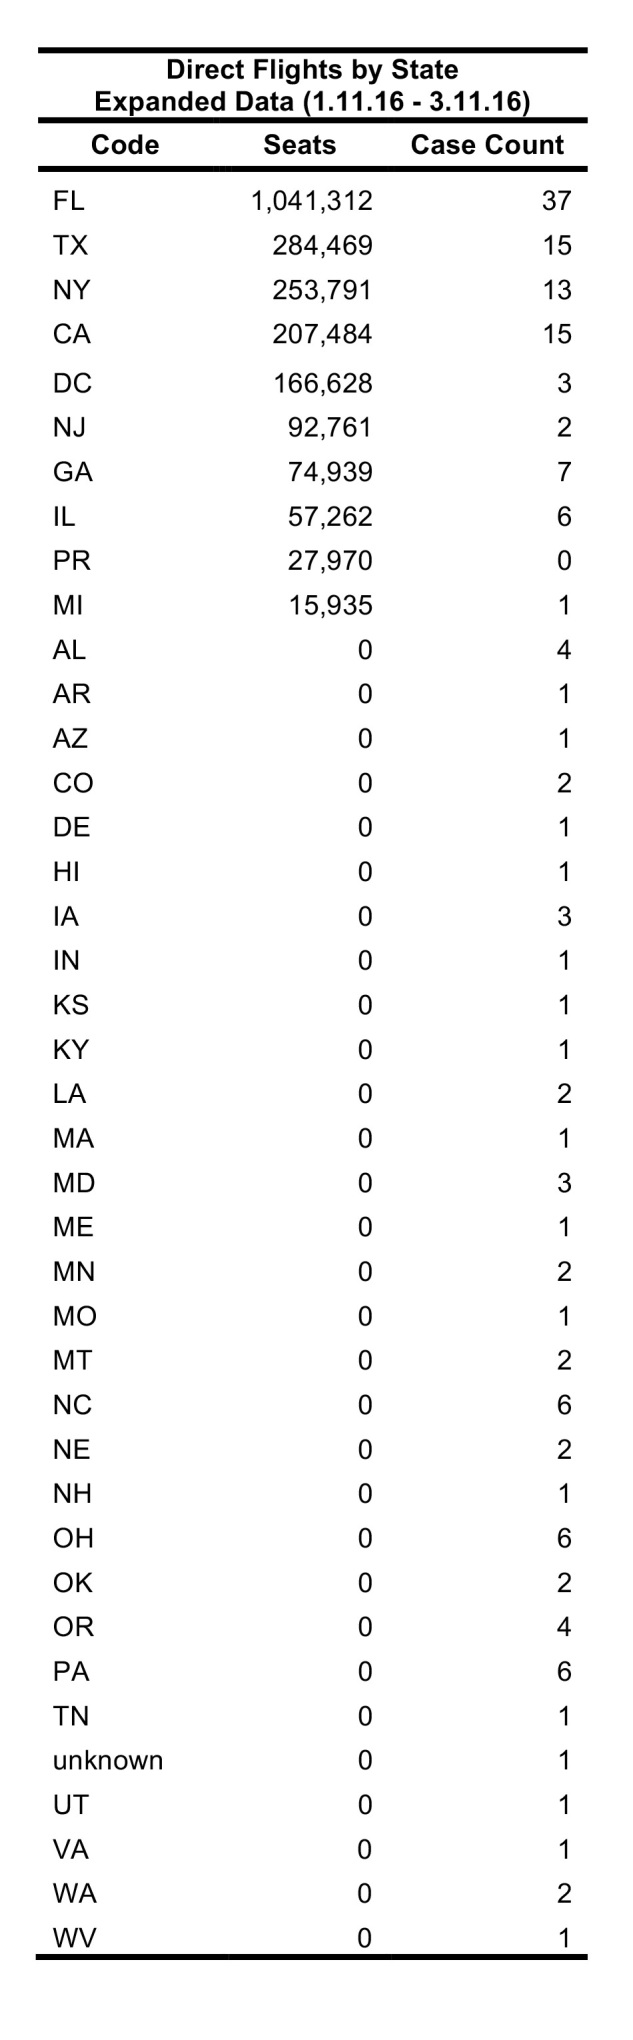
FLIRT was built to predict the flow and likely destinations of infected travelers through the air travel network. FLIRT uses a database of flight schedules from over 800 airlines, and can display direct flight traffic and perform passenger simulations between selected airports. FLIRT was used to analyze flights departing from five selected airports in locations where sustained Zika Virus transmission was occurring. FLIRT's predictions were validated against Zika cases arriving in the U.S. from selected airports during the selected time periods. Kendall's τ and Generalized Linear Models were computed for all permutations of FLIRT and case data to test the accuracy of FLIRT's predictions.
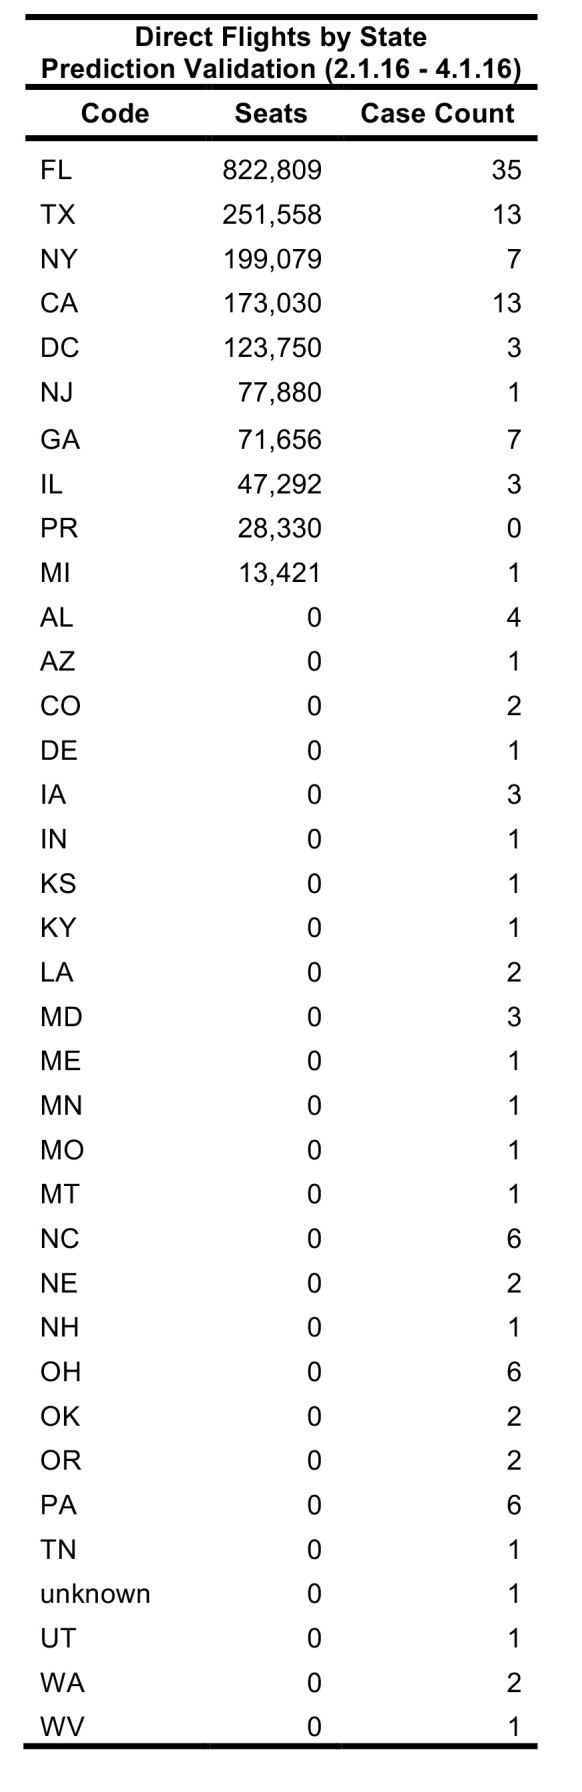
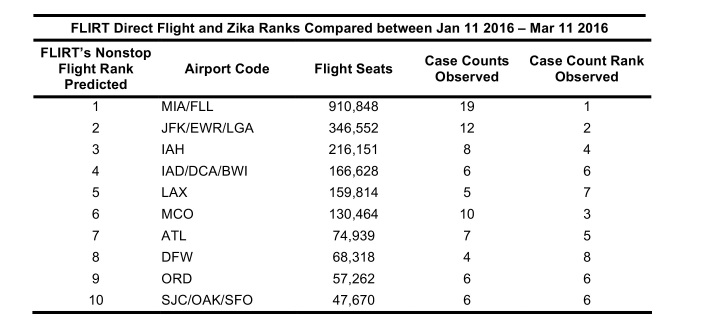
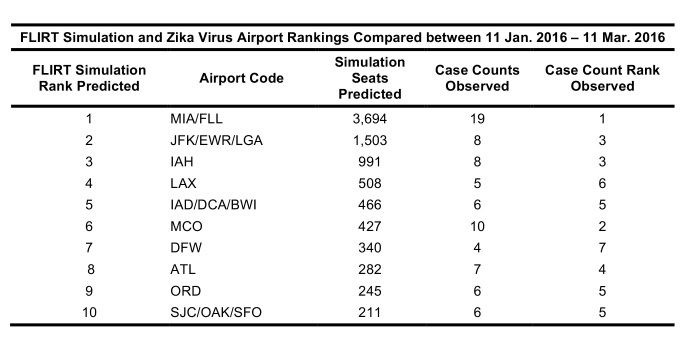
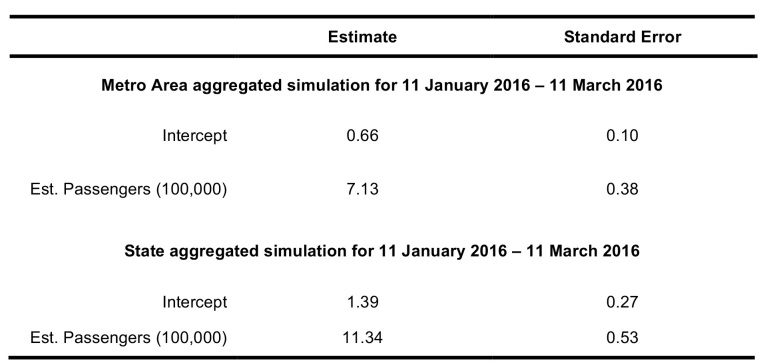
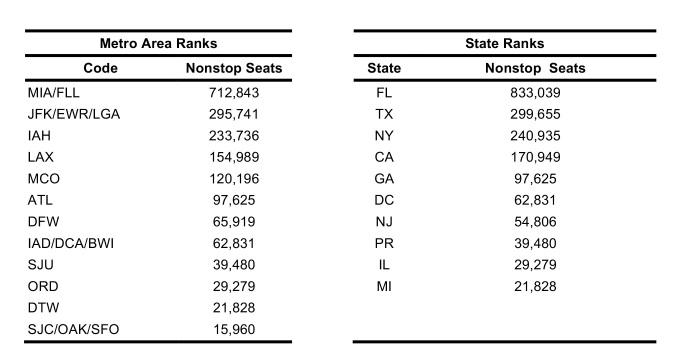
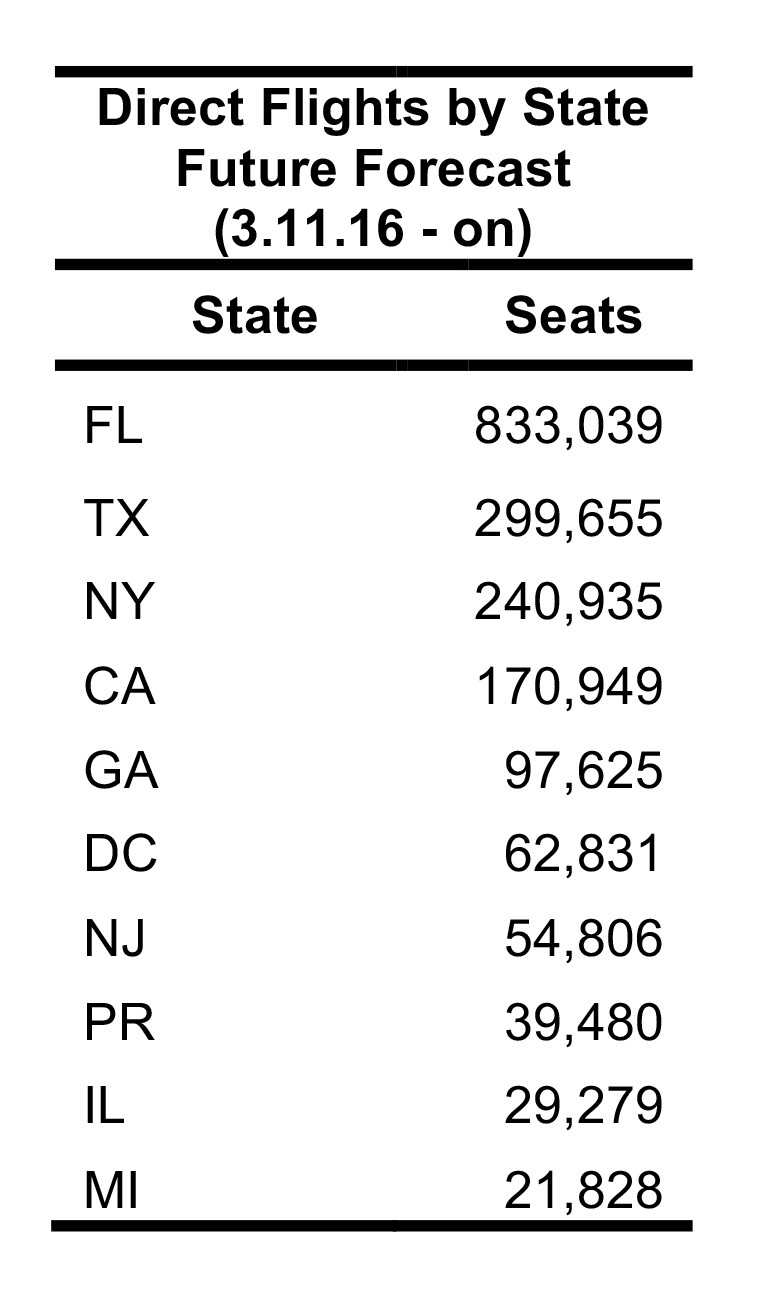
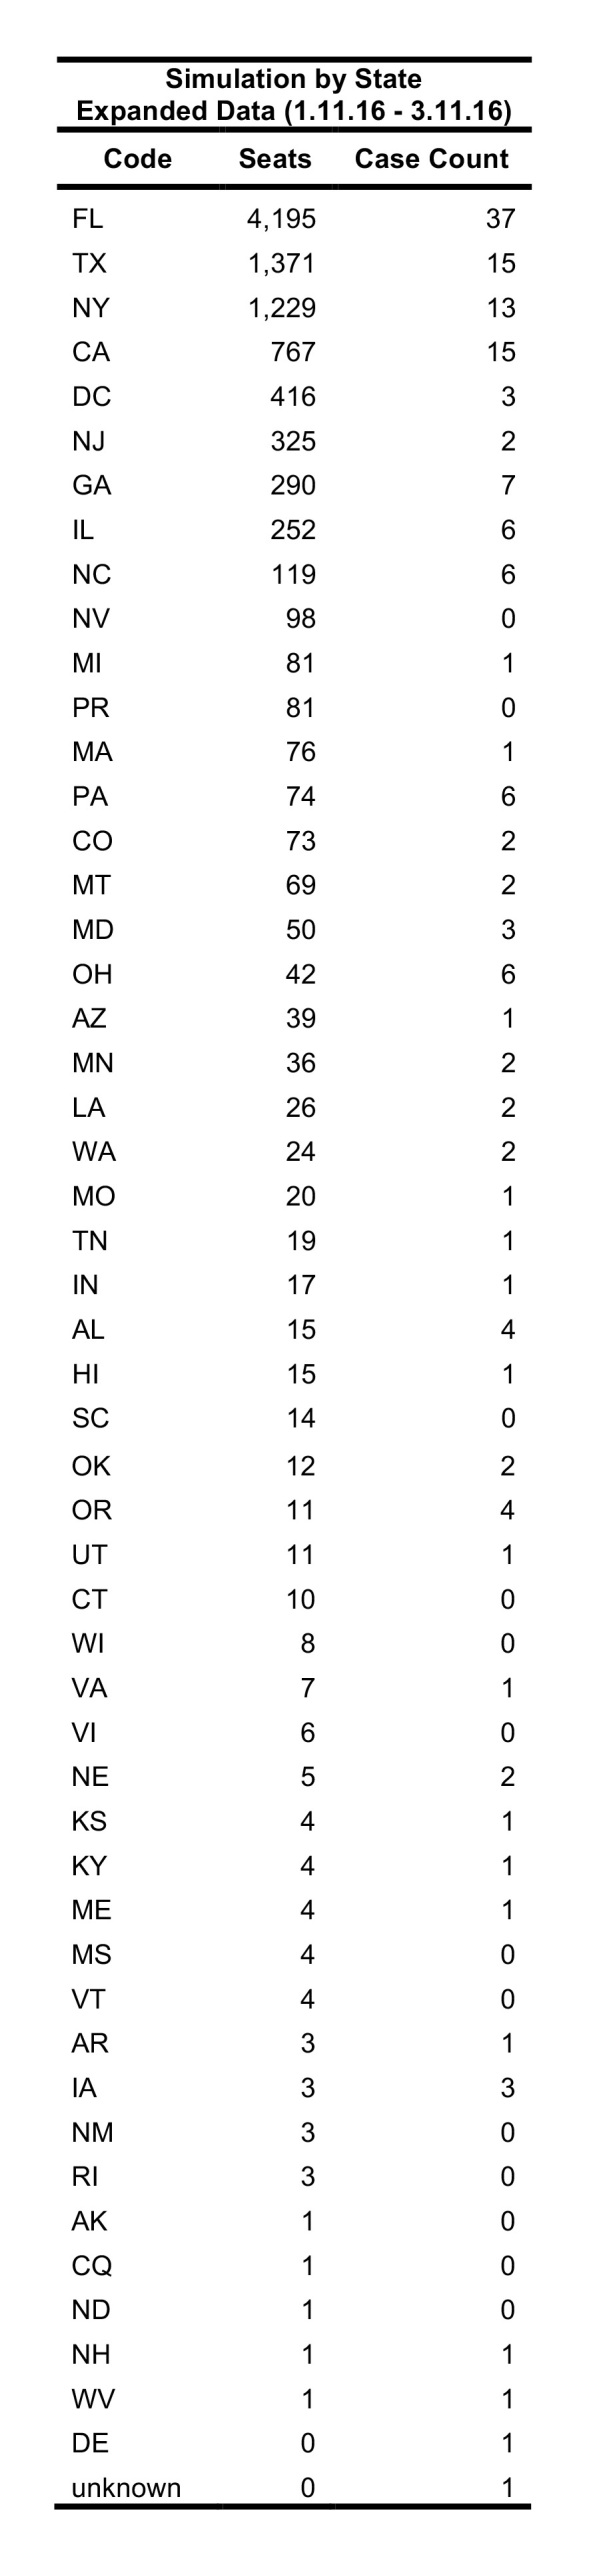
FLIRT was found to be predictive of the final destinations of infected travelers in the U.S. from areas with ongoing transmission of Zika in the Americas from 01 February 2016 - 01 to April 2016, and 11 January 2016 to 11 March 2016 time periods. MIA-FLL, JFK-EWR-LGA, and IAH were top ranked at-risk metro areas, and Florida, Texas and New York were top ranked states at-risk for the future time period analyzed (11 March 2016 - 11 June 2016). For the 11 January 2016 to 11 March 2016 time period, the region-aggregated model indicated 7.24 (95% CI 6.85 - 7.62) imported Zika cases per 100,000 passengers, and the state-aggregated model suggested 11.33 (95% CI 10.80 - 11.90) imported Zika cases per 100,000 passengers.
The results from 01 February 2016 to 01 April 2016 and 11 January 2016 to 11 March 2016 time periods support that modeling air travel and passenger movement can be a powerful tool in predicting where infectious diseases will spread next. As FLIRT was shown to significantly predict distribution of Zika Virus cases in the past, there should be heightened biosurveillance and educational campaigns to medical service providers and the general public in these states, especially in the large metropolitan areas.
自2015年起,寨卡病毒迅速在美洲传播,并与成人及婴儿的神经和自身免疫性疾病有关。开发准确的工具来预测寨卡病毒的传播是减缓该疾病进一步传播的首要步骤之一。将空中交通数据与网络模拟相结合,可用于创建预测传染病可能传播到何处的工具,并有助于预防传染病。具体目标为:1)预测感染寨卡病毒的旅行者将抵达美国的哪些地方;2)使用预测后收集的数据,分析并验证开放式网络应用程序(即FLIRT)的预测结果。
构建FLIRT以预测受感染旅行者通过航空旅行网络的流动情况及可能的目的地。FLIRT使用来自800多家航空公司的航班时刻表数据库,能够显示直飞航班流量,并在选定机场之间进行旅客模拟。FLIRT用于分析从五个选定机场起飞的航班,这些机场所在地区正持续发生寨卡病毒传播。根据选定时间段内从选定机场抵达美国的寨卡病例,对FLIRT的预测结果进行验证。针对FLIRT和病例数据的所有排列组合计算肯德尔τ系数和广义线性模型,以检验FLIRT预测的准确性。
研究发现,在2016年2月1日至2016年4月1日以及2016年1月11日至2016年3月11日这两个时间段内,FLIRT能够预测来自美洲寨卡病毒持续传播地区的受感染旅行者在美国的最终目的地。迈阿密国际机场-劳德代尔堡国际机场、约翰·肯尼迪国际机场-纽瓦克自由国际机场-拉瓜迪亚机场,以及乔治·布什洲际机场是风险最高的前几大地铁区域,而在分析的未来时间段(2016年3月11日至2016年6月11日),佛罗里达州、得克萨斯州和纽约州是风险最高的前几大州。在2016年1月11日至2016年3月11日时间段内,区域汇总模型显示每10万名乘客中有7.24例(95%置信区间6.85 - 7.62)输入性寨卡病例,州汇总模型显示每10万名乘客中有11.33例(95%置信区间10.80 - 11.90)输入性寨卡病例。
2016年2月1日至2016年4月1日以及2016年1月11日至2016年3月11日这两个时间段的结果表明,对航空旅行和旅客流动进行建模可以成为预测传染病下一步传播地点的有力工具。由于FLIRT过去已被证明能显著预测寨卡病毒病例的分布情况,因此应加强对这些州,尤其是大都市地区的医疗服务提供者和公众的生物监测及教育宣传活动。