Tsikata Edem, Lee Ramon, Shieh Eric, Simavli Huseyin, Que Christian J, Guo Rong, Khoueir Ziad, de Boer Johannes, Chen Teresa C
Department of Ophthalmology, Massachusetts Eye and Ear Infirmary, Boston, Massachusetts, United States 2Harvard Medical School, Boston, Massachusetts, United States.
Harvard Medical School, Boston, Massachusetts, United States.
Invest Ophthalmol Vis Sci. 2016 Oct 1;57(13):5498-5508. doi: 10.1167/iovs.16-19802.
To describe spectral-domain optical coherence tomography (OCT) methods for quantifying neuroretinal rim tissue in glaucoma and to compare these methods to the traditional retinal nerve fiber layer thickness diagnostic parameter.
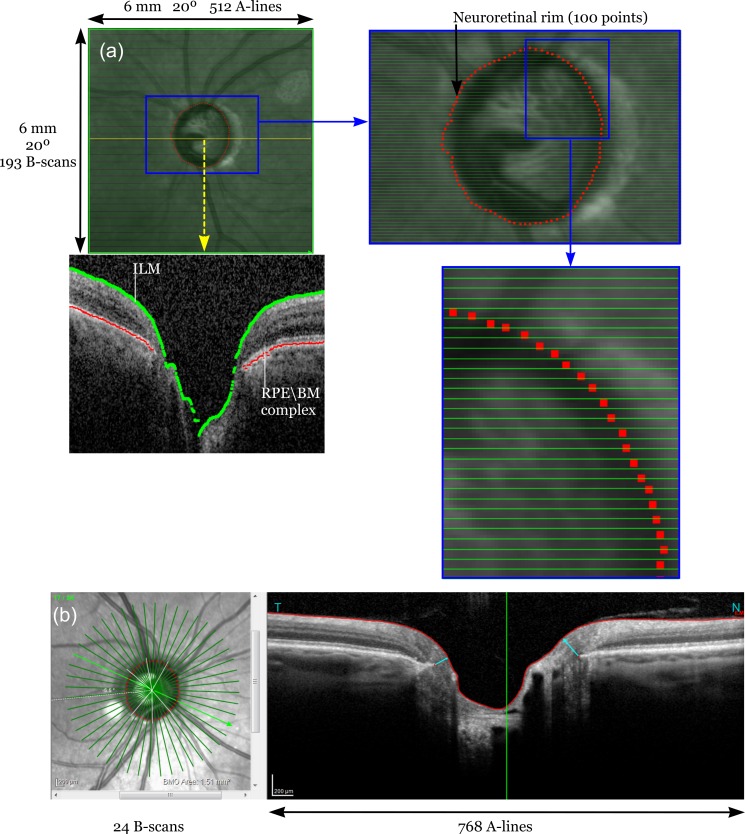
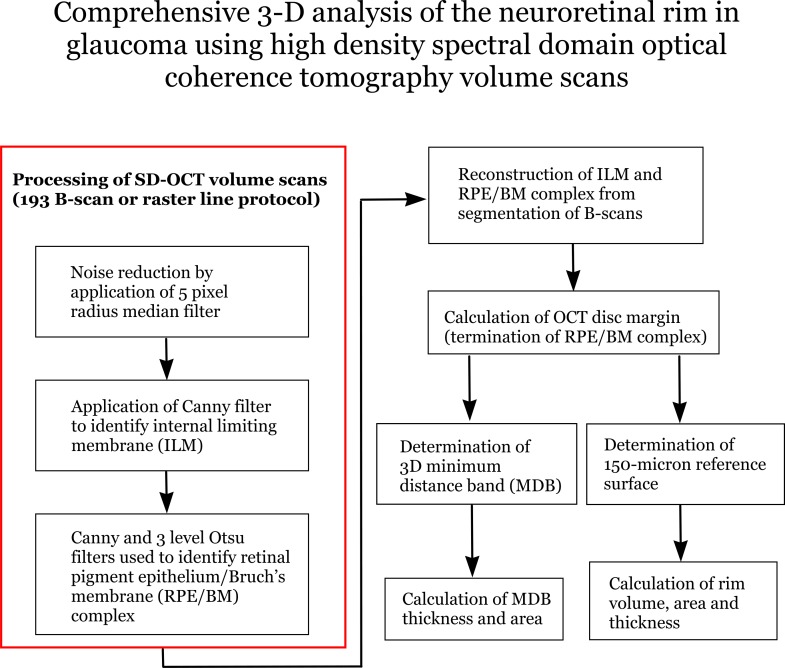
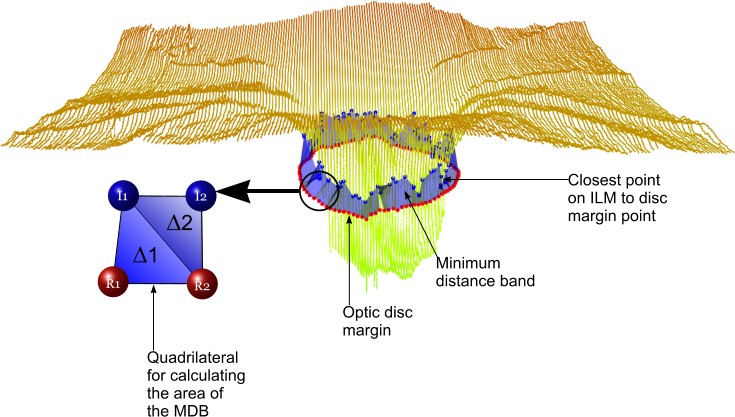
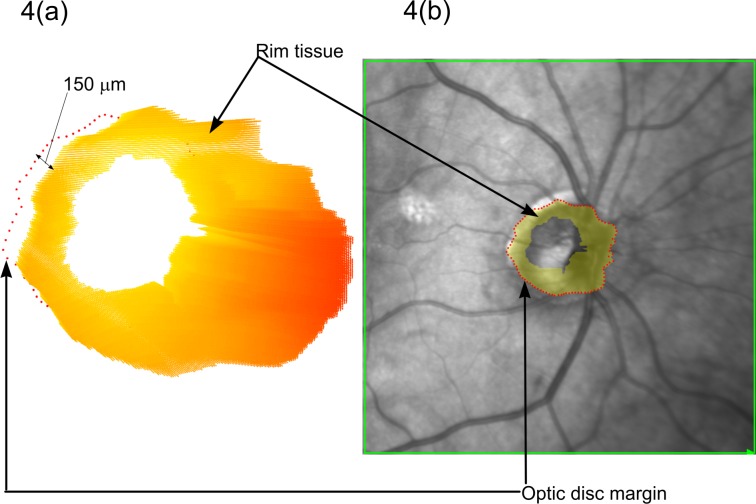
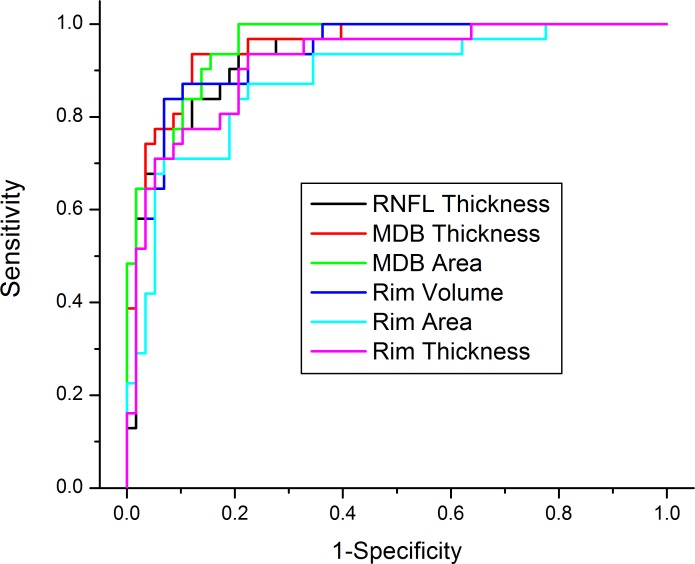
Neuroretinal rim parameters derived from three-dimensional (3D) volume scans were compared with the two-dimensional (2D) Spectralis retinal nerve fiber layer (RNFL) thickness scans for diagnostic capability. This study analyzed one eye per patient of 104 glaucoma patients and 58 healthy subjects. The shortest distances between the cup surface and the OCT-based disc margin were automatically calculated to determine the thickness and area of the minimum distance band (MDB) neuroretinal rim parameter. Traditional 150-μm reference surface-based rim parameters (volume, area, and thickness) were also calculated. The diagnostic capabilities of these five parameters were compared with RNFL thickness using the area under the receiver operating characteristic (AUROC) curves.
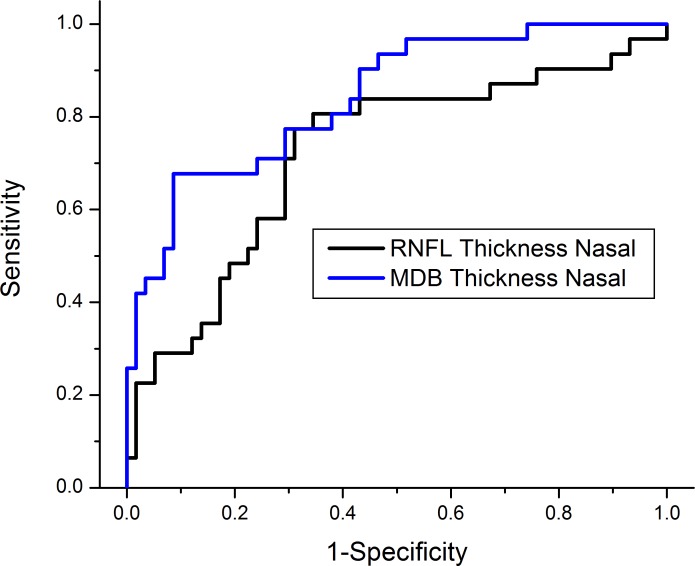
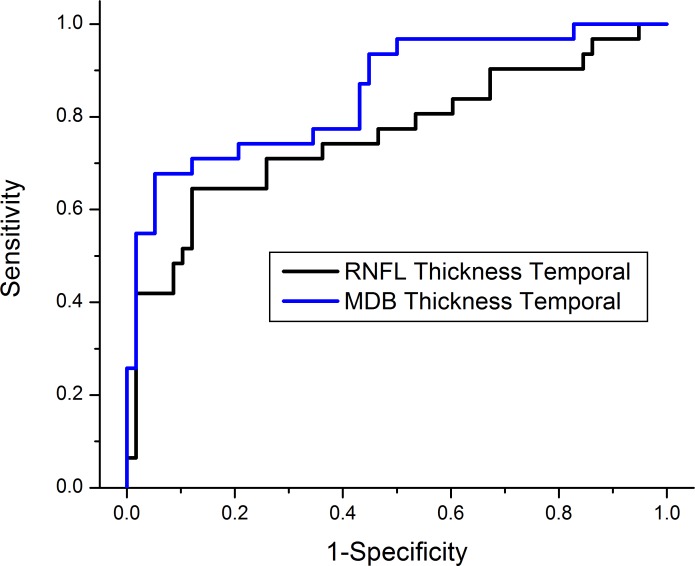
The MDB thickness had significantly higher diagnostic capability than the RNFL thickness in the nasal (0.913 vs. 0.818, P = 0.004) and temporal (0.922 vs. 0.858, P = 0.026) quadrants and the inferonasal (0.950 vs. 0.897, P = 0.011) and superonasal (0.933 vs. 0.868, P = 0.012) sectors. The MDB area and the three neuroretinal rim parameters based on the 150-μm reference surface had diagnostic capabilities similar to RNFL thickness.
The 3D MDB thickness had a high diagnostic capability for glaucoma and may be of significant clinical utility. It had higher diagnostic capability than the RNFL thickness in the nasal and temporal quadrants and the inferonasal and superonasal sectors.
描述用于量化青光眼神经视网膜边缘组织的光谱域光学相干断层扫描(OCT)方法,并将这些方法与传统的视网膜神经纤维层厚度诊断参数进行比较。
将从三维(3D)容积扫描得出的神经视网膜边缘参数与二维(2D)Spectralis视网膜神经纤维层(RNFL)厚度扫描的诊断能力进行比较。本研究分析了104例青光眼患者和58例健康受试者每人的一只眼睛。自动计算视杯表面与基于OCT的视盘边缘之间的最短距离,以确定最小距离带(MDB)神经视网膜边缘参数的厚度和面积。还计算了基于传统150μm参考表面的边缘参数(容积、面积和厚度)。使用受试者操作特征(AUROC)曲线下的面积,将这五个参数的诊断能力与RNFL厚度进行比较。
在鼻侧象限(0.913对0.818,P = 0.004)、颞侧象限(0.922对0.858,P = 0.026)、鼻下象限(0.950对0.897,P = 0.011)和鼻上象限(0.933对0.868,P = 0.012),MDB厚度的诊断能力显著高于RNFL厚度。基于150μm参考表面的MDB面积和三个神经视网膜边缘参数的诊断能力与RNFL厚度相似。
3D MDB厚度对青光眼具有较高的诊断能力,可能具有重要的临床应用价值。在鼻侧和颞侧象限以及鼻下和鼻上象限,其诊断能力高于RNFL厚度。