Boyce Thompson Institute, Ithaca, NY 14853, USA.
Plant Biology Section, School of Integrative Plant Science, Cornell University, Ithaca, NY 14853, USA.
Bioinformatics. 2017 Aug 1;33(15):2397-2398. doi: 10.1093/bioinformatics/btx190.
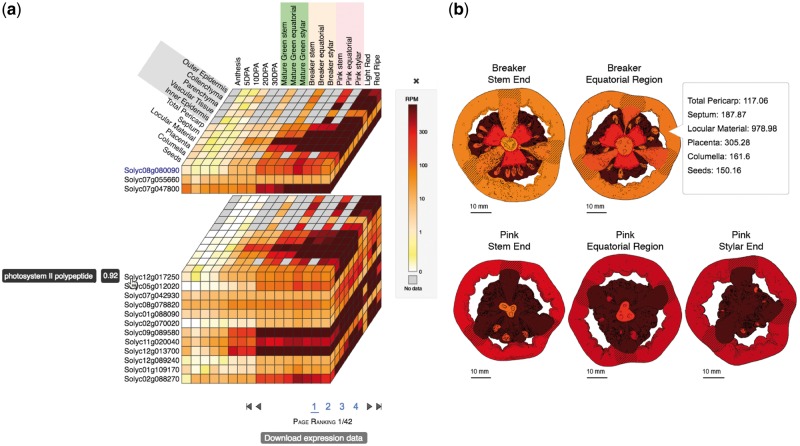
With the development of new high-throughput DNA sequencing technologies and decreasing costs, large gene expression datasets are being generated at an accelerating rate, but can be complex to visualize. New, more interactive and intuitive tools are needed to visualize the spatiotemporal context of expression data and help elucidate gene function. Using tomato fruit as a model, we have developed the Tomato Expression Atlas to facilitate effective data analysis, allowing the simultaneous visualization of groups of genes at a cell/tissue level of resolution within an organ, enhancing hypothesis development and testing in addition to candidate gene identification. This atlas can be adapted to different types of expression data from diverse multicellular species.
The Tomato Expression Atlas is available at http://tea.solgenomics.net/ . Source code is available at https://github.com/solgenomics/Tea .
jr286@cornell.edu or lam87@cornell.edu.
Supplementary data are available at Bioinformatics online.
随着高通量 DNA 测序技术的发展和成本的降低,大量基因表达数据集正以前所未有的速度生成,但可视化这些数据集较为复杂。为了可视化表达数据的时空背景并帮助阐明基因功能,我们需要新的、更具交互性和直观性的工具。我们以番茄果实为模型,开发了番茄表达图谱,以方便有效地进行数据分析,允许在器官内以细胞/组织分辨率同时可视化基因群,除了鉴定候选基因外,还可以增强假说的开发和测试。该图谱可以适应来自不同多细胞物种的不同类型的表达数据。
番茄表达图谱可在 http://tea.solgenomics.net/ 获取。源代码可在 https://github.com/solgenomics/Tea 获取。
jr286@cornell.edu 或 lam87@cornell.edu。
补充数据可在《生物信息学》在线获取。