• 文献检索
  • 文档翻译
  • 深度研究
  • 学术资讯
  • Suppr Zotero 插件Zotero 插件
  • 邀请有礼
  • 套餐&价格
  • 历史记录
应用&插件
Suppr Zotero 插件Zotero 插件浏览器插件Mac 客户端Windows 客户端微信小程序
定价
高级版会员购买积分包购买API积分包
服务
文献检索文档翻译深度研究API 文档MCP 服务
关于我们
关于 Suppr公司介绍联系我们用户协议隐私条款
关注我们

Suppr 超能文献

核心技术专利:CN118964589B侵权必究
粤ICP备2023148730 号-1Suppr @ 2026

文献检索

告别复杂PubMed语法,用中文像聊天一样搜索,搜遍4000万医学文献。AI智能推荐,让科研检索更轻松。

立即免费搜索

文件翻译

保留排版,准确专业,支持PDF/Word/PPT等文件格式,支持 12+语言互译。

免费翻译文档

深度研究

AI帮你快速写综述,25分钟生成高质量综述,智能提取关键信息,辅助科研写作。

立即免费体验

模拟不断变化的人口分布:以1979 - 2009年肯尼亚海岸为例

Modelling changing population distributions: an example of the Kenyan Coast, 1979-2009.

作者信息

Linard Catherine, Kabaria Caroline W, Gilbert Marius, Tatem Andrew J, Gaughan Andrea E, Stevens Forrest R, Sorichetta Alessandro, Noor Abdisalan M, Snow Robert W

机构信息

Spatial Epidemiology Lab (SpELL), Université Libre de Bruxelles, Brussels, Belgium.

Department of Geography, Université de Namur, Namur, Belgium.

出版信息

Int J Digit Earth. 2017 Oct 3;10(10):1017-1029. doi: 10.1080/17538947.2016.1275829. Epub 2017 Jan 11.

DOI:10.1080/17538947.2016.1275829
PMID:29098016
原文链接:https://pmc.ncbi.nlm.nih.gov/articles/PMC5632926/
Abstract

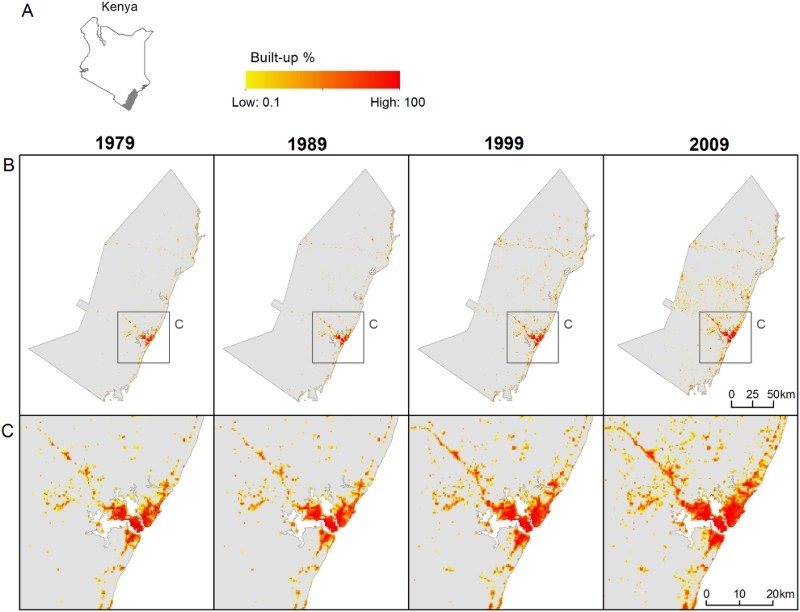
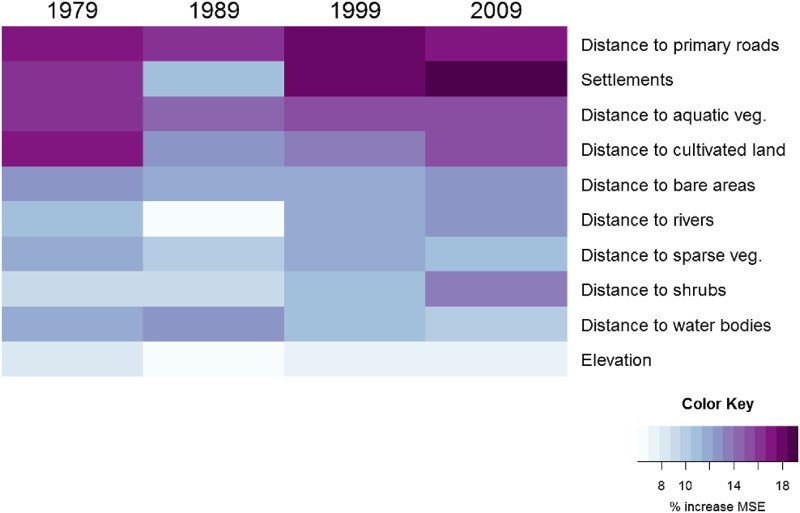
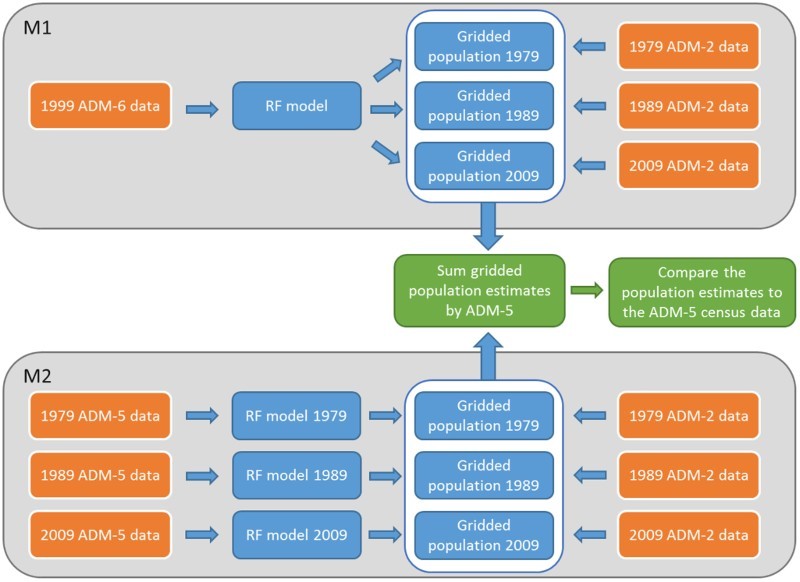
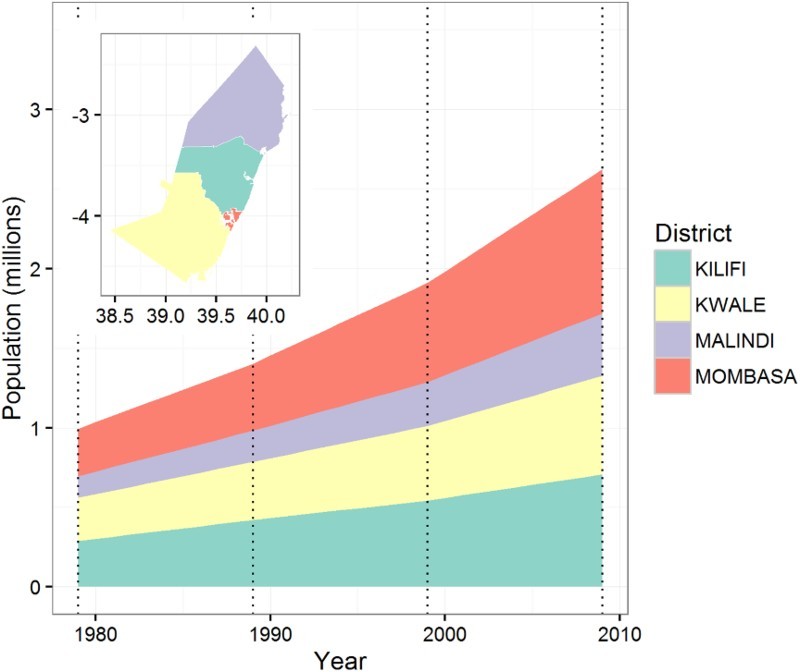
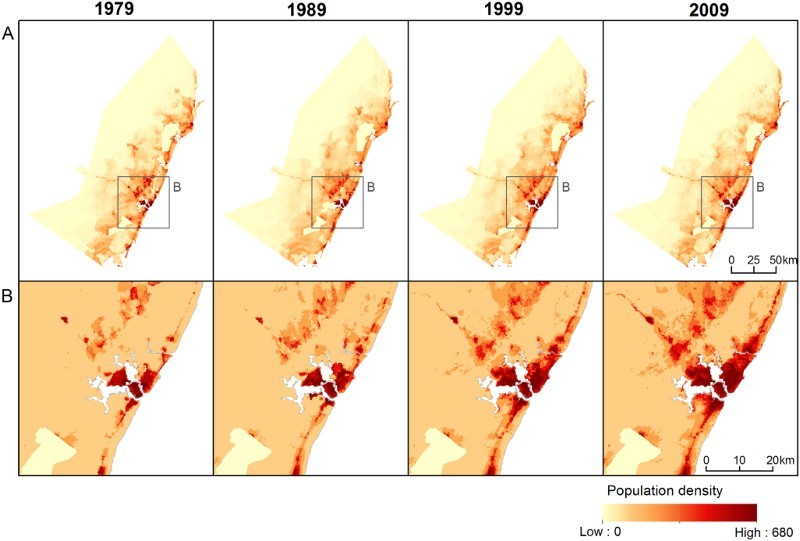
Large-scale gridded population datasets are usually produced for the year of input census data using a top-down approach and projected backward and forward in time using national growth rates. Such temporal projections do not include any subnational variation in population distribution trends and ignore changes in geographical covariates such as urban land cover changes. Improved predictions of population distribution changes over time require the use of a limited number of covariates that are time-invariant or temporally explicit. Here we make use of recently released multi-temporal high-resolution global settlement layers, historical census data and latest developments in population distribution modelling methods to reconstruct population distribution changes over 30 years across the Kenyan Coast. We explore the methodological challenges associated with the production of gridded population distribution time-series in data-scarce countries and show that trade-offs have to be found between spatial and temporal resolutions when selecting the best modelling approach. Strategies used to fill data gaps may vary according to the local context and the objective of the study. This work will hopefully serve as a benchmark for future developments of population distribution time-series that are increasingly required for population-at-risk estimations and spatial modelling in various fields.

摘要

大规模网格化人口数据集通常采用自上而下的方法,根据输入的人口普查数据年份生成,并使用国家增长率在时间上进行前后推算。这种时间推算不包括人口分布趋势的任何次国家层面的变化,并且忽略了地理协变量的变化,如城市土地覆盖变化。要更好地预测人口分布随时间的变化,需要使用数量有限的随时间不变或具有时间明确性的协变量。在此,我们利用最近发布的多时态高分辨率全球住区图层、历史人口普查数据以及人口分布建模方法的最新进展,来重建肯尼亚海岸30年来的人口分布变化。我们探讨了数据稀缺国家在生成网格化人口分布时间序列过程中面临的方法学挑战,并表明在选择最佳建模方法时,必须在空间和时间分辨率之间进行权衡。用于填补数据空白的策略可能因当地情况和研究目标而异。这项工作有望为人口分布时间序列的未来发展提供一个基准,而人口分布时间序列在各个领域的风险人群估计和空间建模中越来越需要。

https://cdn.ncbi.nlm.nih.gov/pmc/blobs/f54e/5632926/0a21bce3185f/tjde_a_1275829_f0006_c.jpg
https://cdn.ncbi.nlm.nih.gov/pmc/blobs/f54e/5632926/e002df1f55f0/tjde_a_1275829_f0001_c.jpg
https://cdn.ncbi.nlm.nih.gov/pmc/blobs/f54e/5632926/1c34427d7e91/tjde_a_1275829_f0002_c.jpg
https://cdn.ncbi.nlm.nih.gov/pmc/blobs/f54e/5632926/1125f1b0fd09/tjde_a_1275829_f0003_c.jpg
https://cdn.ncbi.nlm.nih.gov/pmc/blobs/f54e/5632926/14aaaebebf0e/tjde_a_1275829_f0004_b.jpg
https://cdn.ncbi.nlm.nih.gov/pmc/blobs/f54e/5632926/33412e6e2c83/tjde_a_1275829_f0005_c.jpg
https://cdn.ncbi.nlm.nih.gov/pmc/blobs/f54e/5632926/0a21bce3185f/tjde_a_1275829_f0006_c.jpg

相似文献

1
Modelling changing population distributions: an example of the Kenyan Coast, 1979-2009.模拟不断变化的人口分布:以1979 - 2009年肯尼亚海岸为例
Int J Digit Earth. 2017 Oct 3;10(10):1017-1029. doi: 10.1080/17538947.2016.1275829. Epub 2017 Jan 11.
2
Assessing the use of global land cover data for guiding large area population distribution modelling.评估全球土地覆盖数据在指导大面积人口分布建模中的应用。
GeoJournal. 2011 Oct;76(5):525-538. doi: 10.1007/s10708-010-9364-8. Epub 2010 May 25.
3
Annually modelling built-settlements between remotely-sensed observations using relative changes in subnational populations and lights at night.每年利用次国家层面人口和夜间灯光的相对变化,对遥感观测之间的建成区进行建模。
Comput Environ Urban Syst. 2020 Mar;80:101444. doi: 10.1016/j.compenvurbsys.2019.101444.
4
Global spatio-temporally harmonised datasets for producing high-resolution gridded population distribution datasets.用于生成高分辨率网格化人口分布数据集的全球时空协调数据集。
Big Earth Data. 2019 Jun 18;3(2):108-139. doi: 10.1080/20964471.2019.1625151. eCollection 2019.
5
Global fertility in 204 countries and territories, 1950-2021, with forecasts to 2100: a comprehensive demographic analysis for the Global Burden of Disease Study 2021.204 个国家和地区的全球生育率,1950-2021 年,预测至 2100 年:2021 年全球疾病负担研究的综合人口分析。
Lancet. 2024 May 18;403(10440):2057-2099. doi: 10.1016/S0140-6736(24)00550-6. Epub 2024 Mar 20.
6
A review of geospatial methods for population estimation and their use in constructing reproductive, maternal, newborn, child and adolescent health service indicators.地理空间方法在人口估计中的应用及其在构建生殖、孕产妇、新生儿、儿童和青少年健康服务指标方面的应用综述。
BMC Health Serv Res. 2021 Sep 13;21(Suppl 1):370. doi: 10.1186/s12913-021-06370-y.
7
Mapping high-resolution global gridded population distribution from 1870 to 2100.绘制1870年至2100年的高分辨率全球网格化人口分布图。
Sci Total Environ. 2024 Dec 10;955:176867. doi: 10.1016/j.scitotenv.2024.176867. Epub 2024 Oct 15.
8
From top to bottom: gridded human population estimates in data-poor situations.从上到下:数据匮乏情况下的网格化人口估计。
Rev Sci Tech. 2023 May;42:111-119. doi: 10.20506/rst.42.3354.
9
The 2023 Latin America report of the Countdown on health and climate change: the imperative for health-centred climate-resilient development.《2023年健康与气候变化倒计时拉丁美洲报告:以健康为中心的气候适应型发展的必要性》
Lancet Reg Health Am. 2024 Apr 23;33:100746. doi: 10.1016/j.lana.2024.100746. eCollection 2024 May.
10
Machine learning based estimation of field-scale daily, high resolution, multi-depth soil moisture for the Western and Midwestern United States.基于机器学习的美国西部和中西部大尺度、高分辨率、多深度逐日土壤湿度估算。
PeerJ. 2022 Nov 4;10:e14275. doi: 10.7717/peerj.14275. eCollection 2022.

引用本文的文献

1
Using big data for evaluating development outcomes: A systematic map.利用大数据评估发展成果:一项系统综述
Campbell Syst Rev. 2021 Jul 3;17(3):e1149. doi: 10.1002/cl2.1149. eCollection 2021 Sep.
2
The Spatiotemporal Evolution Characteristics of Cultivated Land Multifunction and Its Trade-Off/Synergy Relationship in the Two Lake Plains.两湖平原耕地多功能时空演变特征及其权衡/协同关系。
Int J Environ Res Public Health. 2022 Nov 15;19(22):15040. doi: 10.3390/ijerph192215040.
3
Measuring the contribution of built-settlement data to global population mapping.

本文引用的文献

1
Spatiotemporal patterns of population in mainland China, 1990 to 2010.中国大陆 1990 年至 2010 年的人口时空格局。
Sci Data. 2016 Feb 16;3:160005. doi: 10.1038/sdata.2016.5.
2
Disaggregating census data for population mapping using random forests with remotely-sensed and ancillary data.使用随机森林结合遥感数据和辅助数据对人口普查数据进行分解以绘制人口地图。
PLoS One. 2015 Feb 17;10(2):e0107042. doi: 10.1371/journal.pone.0107042. eCollection 2015.
3
Dynamic population mapping using mobile phone data.利用手机数据进行动态人口地图绘制。
衡量建成区定居点数据对全球人口地图绘制的贡献。
Soc Sci Humanit Open. 2021;3(1):100102. doi: 10.1016/j.ssaho.2020.100102.
4
Modelling and mapping the intra-urban spatial distribution of Plasmodium falciparum parasite rate using very-high-resolution satellite derived indicators.利用超高分辨率卫星衍生指标对恶性疟原虫感染率的城市内空间分布进行建模和制图。
Int J Health Geogr. 2020 Sep 21;19(1):38. doi: 10.1186/s12942-020-00232-2.
5
Estimating the size of urban populations using Landsat images: a case study of Bo, Sierra Leone, West Africa.利用 Landsat 图像估算城市人口规模:以西非塞拉利昂博城为例。
Int J Health Geogr. 2019 Jul 11;18(1):16. doi: 10.1186/s12942-019-0180-1.
6
The thin(ning) green line? Investigating changes in Kenya's seagrass coverage.这条薄(绿)线?探究肯尼亚海草覆盖率的变化。
Biol Lett. 2018 Nov 28;14(11):20180227. doi: 10.1098/rsbl.2018.0227.
7
Assessing the Accuracy of Multi-Temporal Built-Up Land Layers across Rural-Urban Trajectories in the United States.评估美国城乡发展轨迹上多时期建成区土地层的准确性。
Remote Sens Environ. 2018 Jan;204:898-917. doi: 10.1016/j.rse.2017.08.035. Epub 2017 Oct 7.
Proc Natl Acad Sci U S A. 2014 Nov 11;111(45):15888-93. doi: 10.1073/pnas.1408439111. Epub 2014 Oct 27.
4
Modelling spatial patterns of urban growth in Africa.非洲城市增长空间模式建模。
Appl Geogr. 2013 Oct;44:23-32. doi: 10.1016/j.apgeog.2013.07.009.
5
The changing risk of Plasmodium falciparum malaria infection in Africa: 2000-10: a spatial and temporal analysis of transmission intensity.非洲间日疟原虫感染风险的变化:2000-2010 年:传播强度的时空分析。
Lancet. 2014 May 17;383(9930):1739-47. doi: 10.1016/S0140-6736(13)62566-0. Epub 2014 Feb 20.
6
Urbanization and the global malaria recession.城市化与全球疟疾消退
Malar J. 2013 Apr 17;12:133. doi: 10.1186/1475-2875-12-133.
7
Assessing the use of global land cover data for guiding large area population distribution modelling.评估全球土地覆盖数据在指导大面积人口分布建模中的应用。
GeoJournal. 2011 Oct;76(5):525-538. doi: 10.1007/s10708-010-9364-8. Epub 2010 May 25.
8
High resolution population distribution maps for Southeast Asia in 2010 and 2015.2010 年和 2015 年东南亚高分辨率人口分布地图。
PLoS One. 2013;8(2):e55882. doi: 10.1371/journal.pone.0055882. Epub 2013 Feb 13.
9
The changing limits and incidence of malaria in Africa: 1939-2009.非洲疟疾的变化范围和发病率:1939-2009 年。
Adv Parasitol. 2012;78:169-262. doi: 10.1016/B978-0-12-394303-3.00010-4.
10
Large-scale spatial population databases in infectious disease research.传染病研究中的大规模空间人口数据库。
Int J Health Geogr. 2012 Mar 20;11:7. doi: 10.1186/1476-072X-11-7.