Université de Montréal Public Health Research Institute (IRSPUM) & Montréal Public Health Department, Montréal, Canada.
Department of Civil, Geological and Mining Engineering, École Polytechnique de Montréal, Montréal, Canada.
J Urban Health. 2018 Apr;95(2):196-207. doi: 10.1007/s11524-017-0222-6.
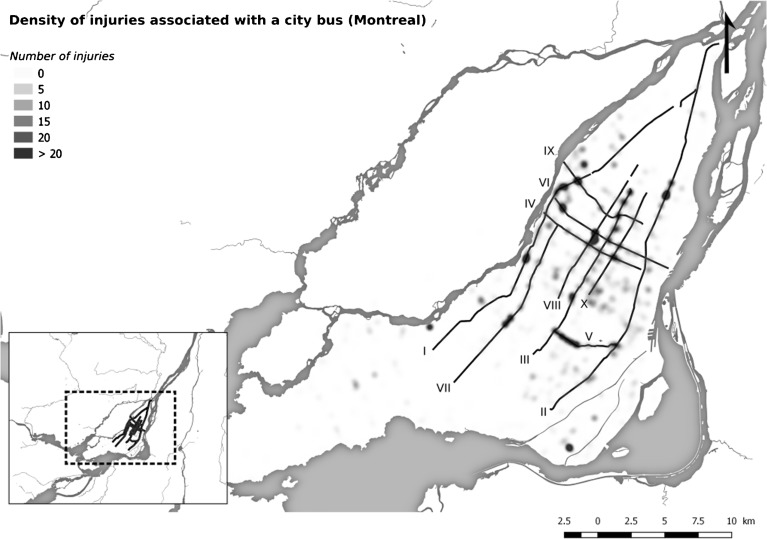
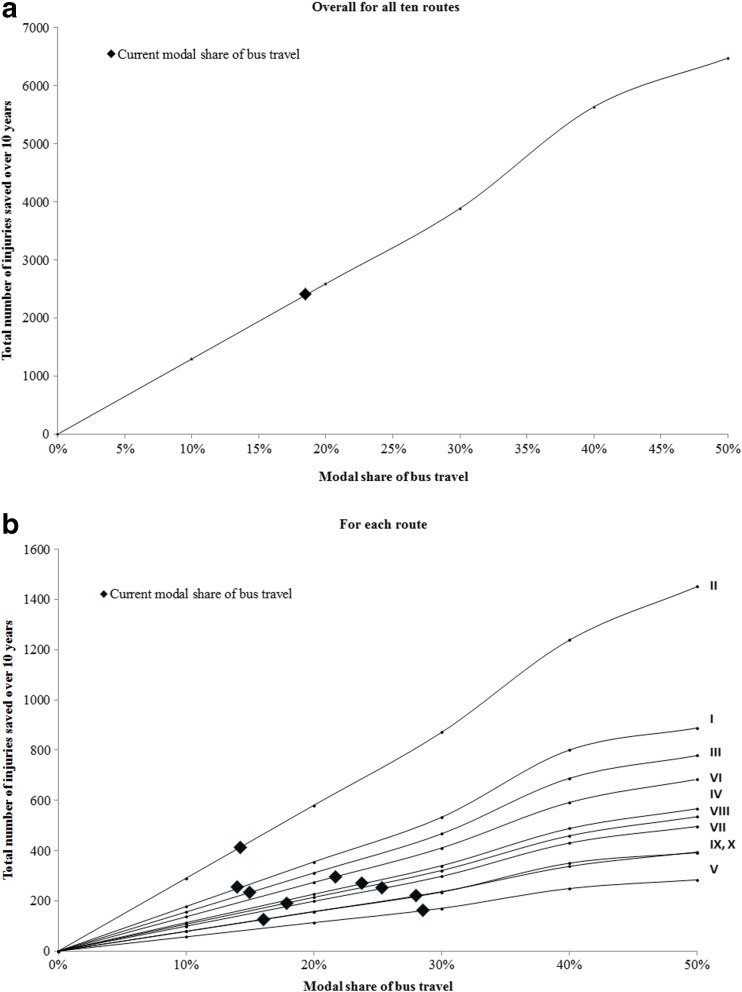
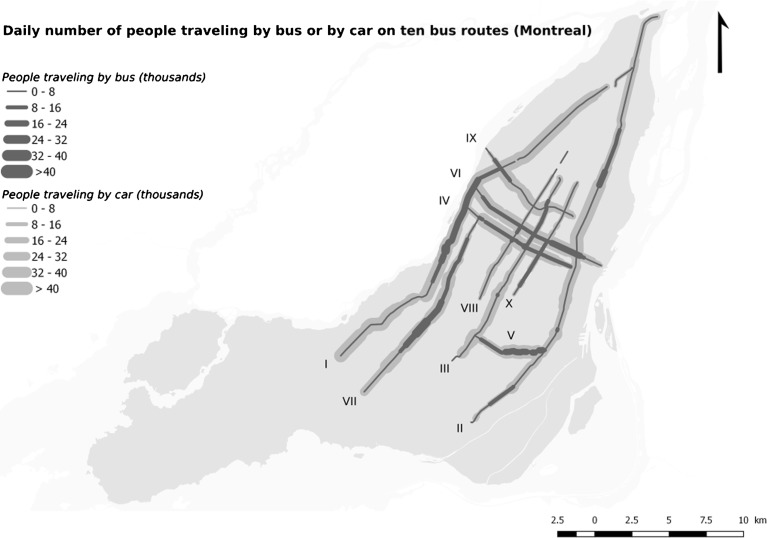
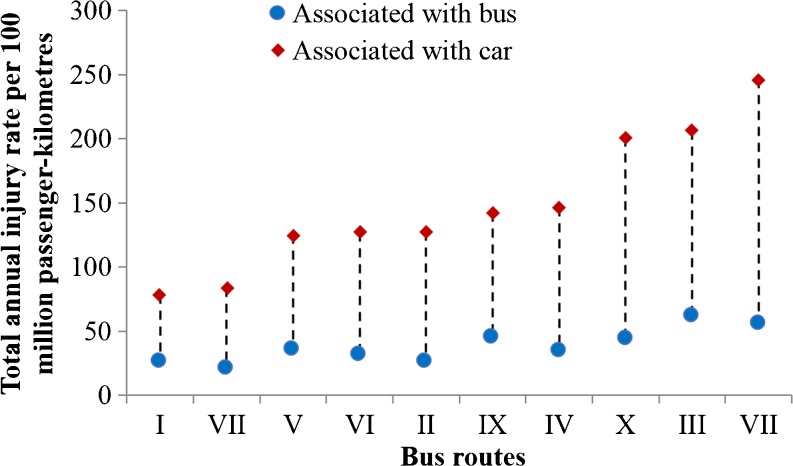
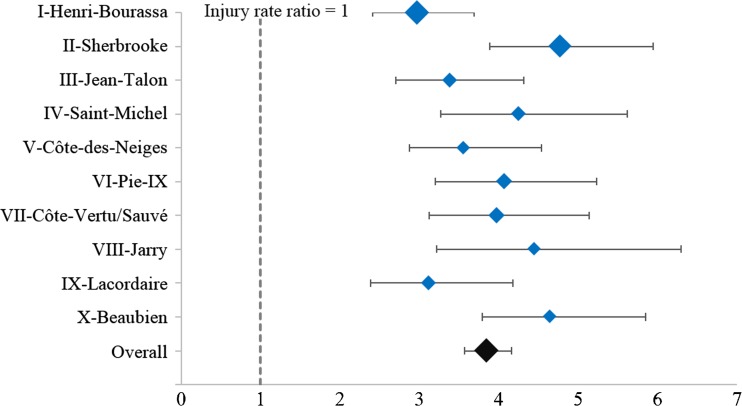
Some studies have estimated fatality and injury rates for bus occupants, but data was aggregated at the country level and made no distinction between bus types. Also, injured pedestrians and cyclists, as a result of bus travel, were overlooked. We compared injury rates for car and city bus occupants on specific urban major roads, as well as the cyclist and pedestrian injuries associated with car and bus travel. We selected ten bus routes along major urban arterials (in Montreal, Canada). Passenger-kilometers traveled were estimated from vehicle counts at intersections (2002-2010) and from bus passenger counts (2008). Police accident reports (2001-2010) provided injury data for all modes. Injury rates associated with car and bus travel were calculated for vehicle occupants, pedestrians, and cyclists. Injury rate ratios were also computed. The safety benefits of bus travel, defined as the number of vehicle occupant, cyclist, and pedestrian injuries saved, were estimated for each route. Overall, for all ten routes, the ratio between car and bus occupant injury rates is 3.7 (95% CI [3.4, 4.0]). The rates of pedestrian and cyclist injuries per hundred million passenger-kilometers are also significantly greater for car travel than that for bus travel: 4.1 (95% CI [3.5, 4.9]) times greater for pedestrian injuries; 5.3 (95% CI [3.8, 7.6]) times greater for cyclist injuries. Similar results were observed for fatally and severely injured vehicle occupants, cyclists, and pedestrians. At the route level, the safety benefits of bus travel increase with the difference in injury rate associated with car and bus travel but also with the amount of passenger-kilometers by bus. Results show that city bus is a safer mode than car, for vehicle occupants but also for cyclists and pedestrians traveling along these bus routes. The safety benefits of bus travel greatly vary across urban routes; this spatial variation is most likely linked to environmental factors. Understanding the safety benefits of public transit for specific transport routes is likely to provide valuable information for mobilizing city and transportation planners.
一些研究估计了公共汽车乘客的死亡率和受伤率,但数据是在国家层面上汇总的,没有区分公共汽车的类型。此外,还忽略了因公共汽车旅行而受伤的行人和骑自行车的人。我们比较了特定城市主要道路上汽车和城市公交车乘客的受伤率,以及与汽车和公共汽车旅行相关的行人和骑自行车的人受伤率。我们选择了 10 条沿着城市主要干道的公交线路(在加拿大蒙特利尔)。从路口的车辆计数(2002-2010 年)和公共汽车乘客计数(2008 年)估计了乘客公里数。警方事故报告(2001-2010 年)提供了所有模式的伤害数据。为汽车和公共汽车旅行的车辆乘客、行人和骑自行车的人计算了受伤率。还计算了受伤率比。为每条路线估算了公共汽车旅行的安全效益,定义为节省的车辆乘客、骑自行车的人和行人受伤人数。总体而言,对于所有十条路线,汽车和公共汽车乘客受伤率的比值为 3.7(95%CI [3.4, 4.0])。每亿乘客公里的行人和骑自行车的人受伤率也明显高于汽车旅行:行人受伤的比例高 4.1 倍(95%CI [3.5, 4.9]);骑自行车的人受伤的比例高 5.3 倍(95%CI [3.8, 7.6])。对于致命和重伤的车辆乘客、骑自行车的人和行人,也观察到了类似的结果。在路线层面上,公共汽车旅行的安全效益随着与汽车和公共汽车旅行相关的受伤率的差异以及公共汽车的乘客公里数的增加而增加。结果表明,对于这些公交线路上的车辆乘客以及骑自行车的人和行人,城市公交车比汽车更安全。公共汽车旅行的安全效益在城市路线之间差异很大;这种空间差异很可能与环境因素有关。了解特定交通路线的公共交通的安全效益可能为动员城市和交通规划者提供有价值的信息。