MRC Integrative Epidemiology Unit, Population Health Sciences, University of Bristol, Bristol, UK.
Institute for Biomedicine, Eurac Research, Bolzano, Italy.
Int J Epidemiol. 2018 Aug 1;47(4):1264-1278. doi: 10.1093/ije/dyy101.
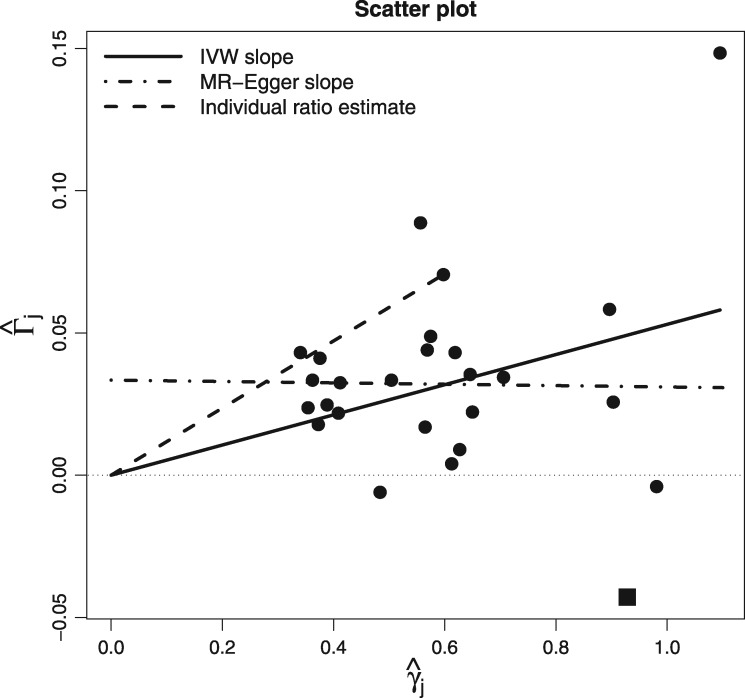
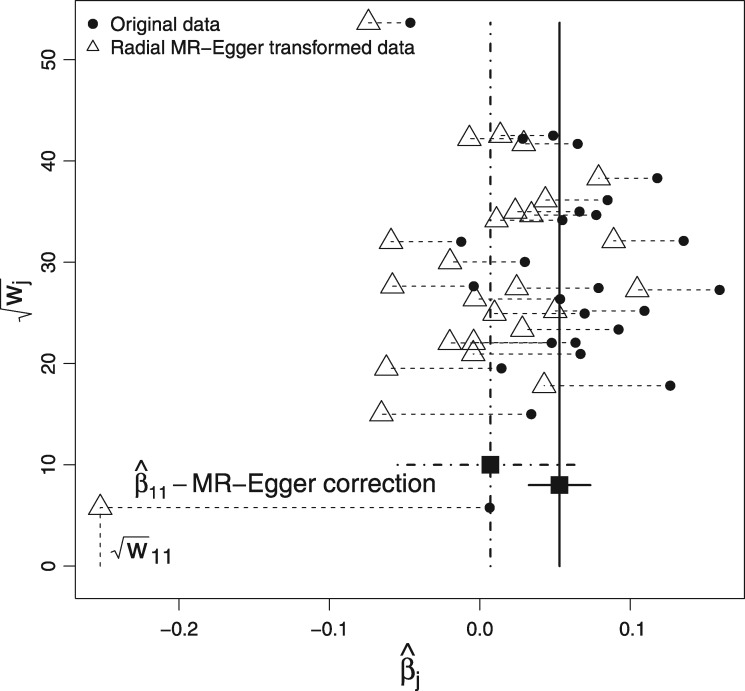
data furnishing a two-sample Mendelian randomization (MR) study are often visualized with the aid of a scatter plot, in which single-nucleotide polymorphism (SNP)-outcome associations are plotted against the SNP-exposure associations to provide an immediate picture of the causal-effect estimate for each individual variant. It is also convenient to overlay the standard inverse-variance weighted (IVW) estimate of causal effect as a fitted slope, to see whether an individual SNP provides evidence that supports, or conflicts with, the overall consensus. Unfortunately, the traditional scatter plot is not the most appropriate means to achieve this aim whenever SNP-outcome associations are estimated with varying degrees of precision and this is reflected in the analysis.
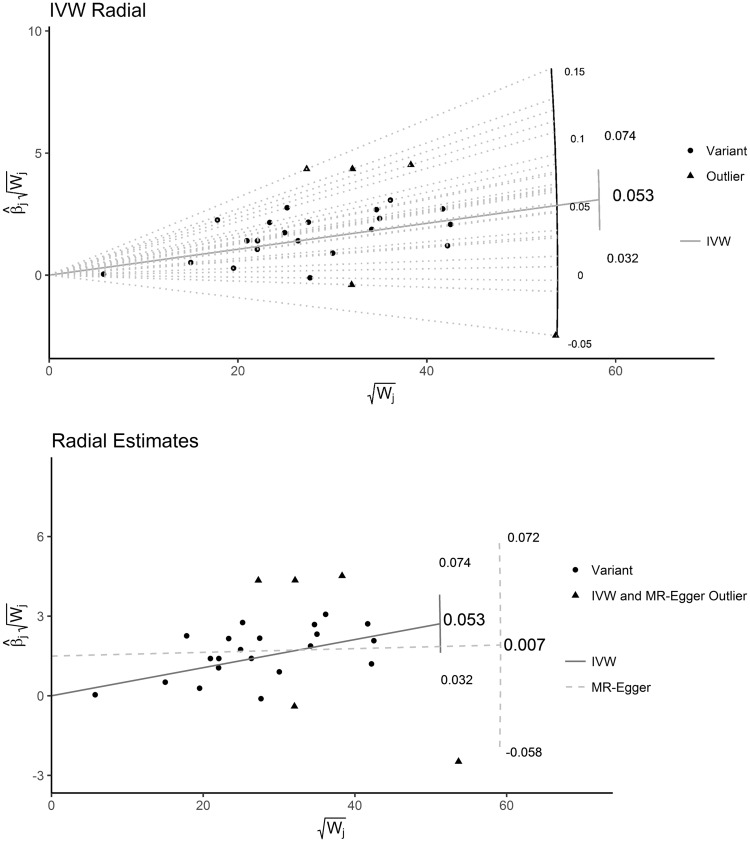
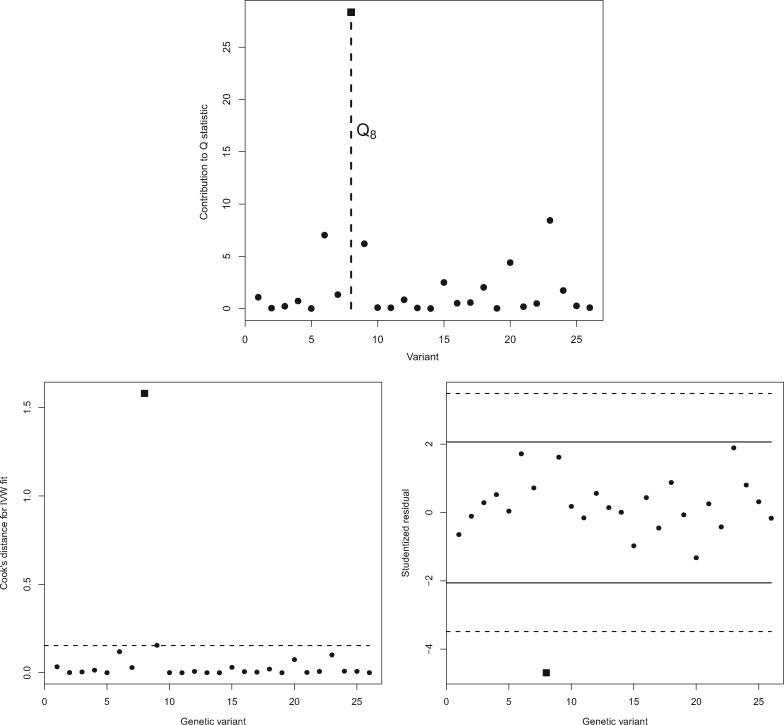
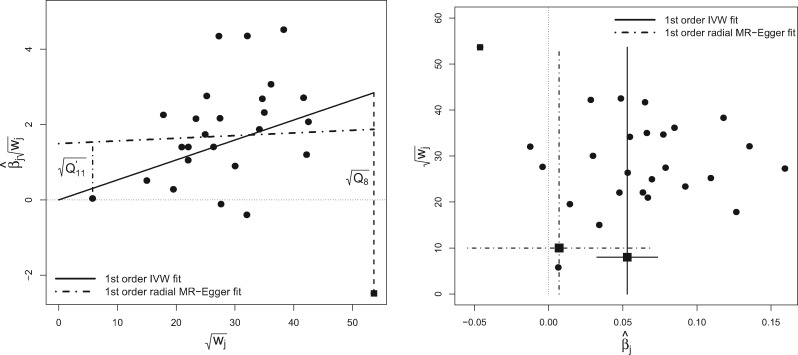
We propose instead to use a small modification of the scatter plot-the Galbraith Radial plot-for the presentation of data and results from an MR study, which enjoys many advantages over the original method. On a practical level, it removes the need to recode the genetic data and enables a more straightforward detection of outliers and influential data points. Its use extends beyond the purely aesthetic, however, to suggest a more general modelling framework to operate within when conducting an MR study, including a new form of MR-Egger regression.
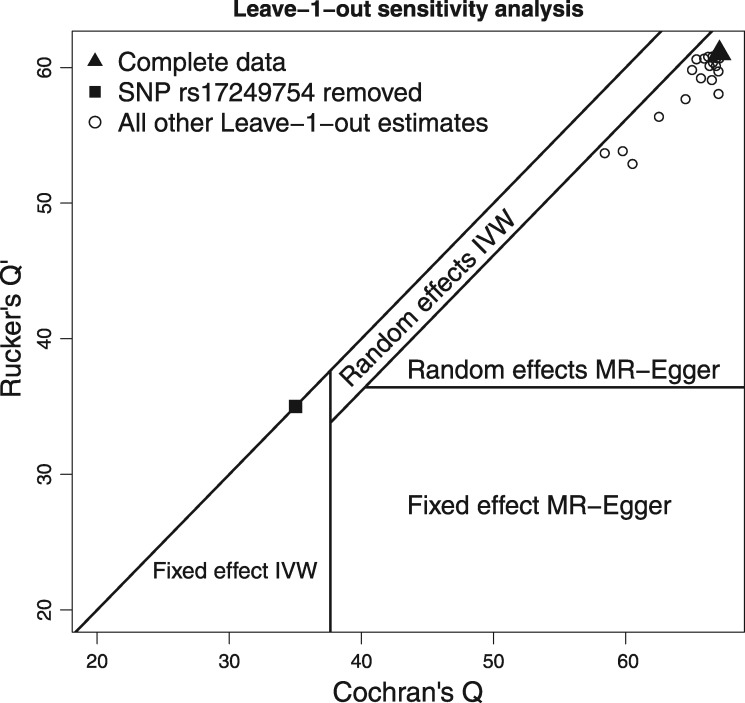
We illustrate the methods using data from a two-sample MR study to probe the causal effect of systolic blood pressure on coronary heart disease risk, allowing for the possible effects of pleiotropy. The Radial plot is shown to aid the detection of a single outlying variant that is responsible for large differences between IVW and MR-Egger regression estimates. Several additional plots are also proposed for informative data visualization.
The Radial plot should be considered in place of the scatter plot for visualizing, analysing and interpreting data from a two-sample summary data MR study. Software is provided to help facilitate its use.
提供双样本 Mendelian 随机化 (MR) 研究的数据通常借助散点图进行可视化,其中单核苷酸多态性 (SNP)-结果关联与 SNP-暴露关联进行对比,为每个个体变体的因果效应估计提供直观的图像。将因果效应的标准逆方差加权 (IVW) 估计值叠加为拟合斜率也很方便,以观察个体 SNP 是否提供支持或与整体共识相冲突的证据。不幸的是,传统的散点图并不是在 SNP-结果关联的估计精度不同且在分析中反映出来的情况下实现这一目标的最合适方法。
我们建议使用 MR 研究中数据和结果呈现的散点图的一个小修改,即 Galbraith 径向图,该方法具有许多优于原始方法的优点。在实际层面上,它无需重新编码遗传数据,并能够更直接地检测异常值和有影响力的数据点。它的使用不仅限于纯粹的美学,而是扩展到更一般的建模框架,以在进行 MR 研究时使用,包括一种新的 MR-Egger 回归形式。
我们使用来自双样本 MR 研究的数据来说明这些方法,以探测收缩压对冠心病风险的因果效应,同时考虑可能存在的多效性影响。径向图有助于检测单个异常变体,该变体导致 IVW 和 MR-Egger 回归估计之间存在较大差异。还提出了其他几个附加图,以进行信息丰富的数据可视化。
径向图应考虑替代散点图,用于可视化、分析和解释双样本汇总数据 MR 研究的数据。提供了软件来帮助促进其使用。