• 文献检索
  • 文档翻译
  • 深度研究
  • 学术资讯
  • Suppr Zotero 插件Zotero 插件
  • 邀请有礼
  • 套餐&价格
  • 历史记录
应用&插件
Suppr Zotero 插件Zotero 插件浏览器插件Mac 客户端Windows 客户端微信小程序
定价
高级版会员购买积分包购买API积分包
服务
文献检索文档翻译深度研究API 文档MCP 服务
关于我们
关于 Suppr公司介绍联系我们用户协议隐私条款
关注我们

Suppr 超能文献

核心技术专利:CN118964589B侵权必究
粤ICP备2023148730 号-1Suppr @ 2026

文献检索

告别复杂PubMed语法,用中文像聊天一样搜索,搜遍4000万医学文献。AI智能推荐,让科研检索更轻松。

立即免费搜索

文件翻译

保留排版,准确专业,支持PDF/Word/PPT等文件格式,支持 12+语言互译。

免费翻译文档

深度研究

AI帮你快速写综述,25分钟生成高质量综述,智能提取关键信息,辅助科研写作。

立即免费体验

潜在自然植被的全球制图:用于估算土地潜力的机器学习算法评估

Global mapping of potential natural vegetation: an assessment of machine learning algorithms for estimating land potential.

作者信息

Hengl Tomislav, Walsh Markus G, Sanderman Jonathan, Wheeler Ichsani, Harrison Sandy P, Prentice Iain C

机构信息

Envirometrix Ltd, Wageningen, Netherlands.

The Earth Institute, Columbia University, New York, NY, USA.

出版信息

PeerJ. 2018 Aug 22;6:e5457. doi: 10.7717/peerj.5457. eCollection 2018.

DOI:10.7717/peerj.5457
PMID:30155360
原文链接:https://pmc.ncbi.nlm.nih.gov/articles/PMC6109375/
Abstract

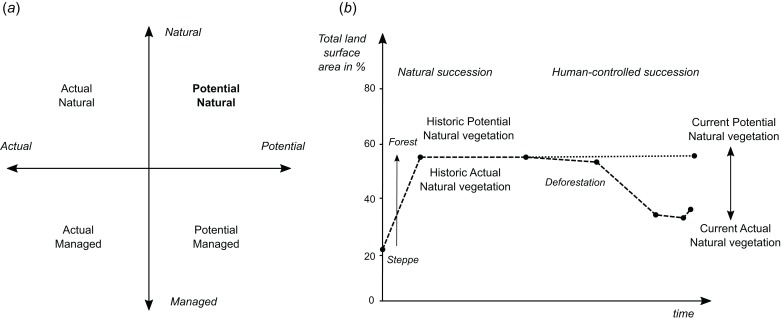
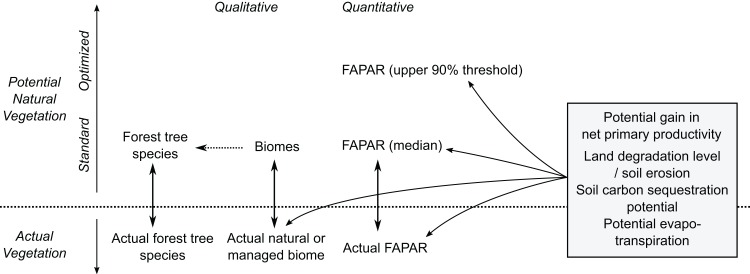
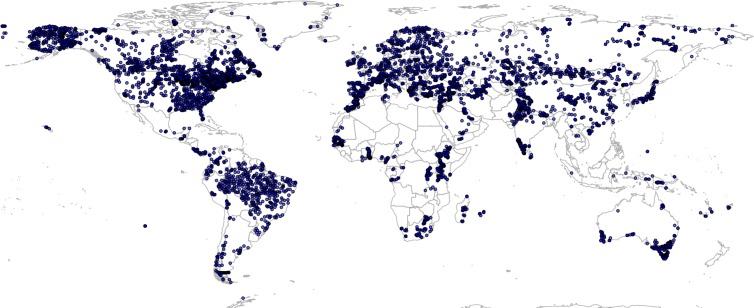
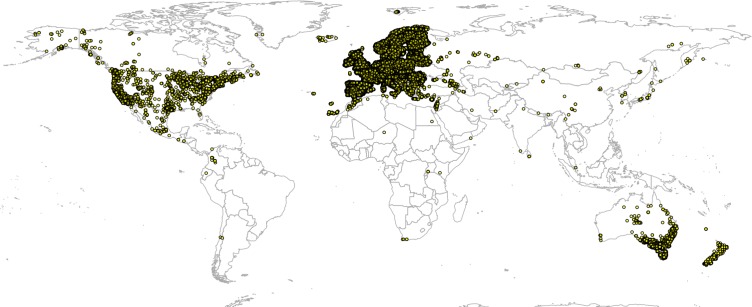
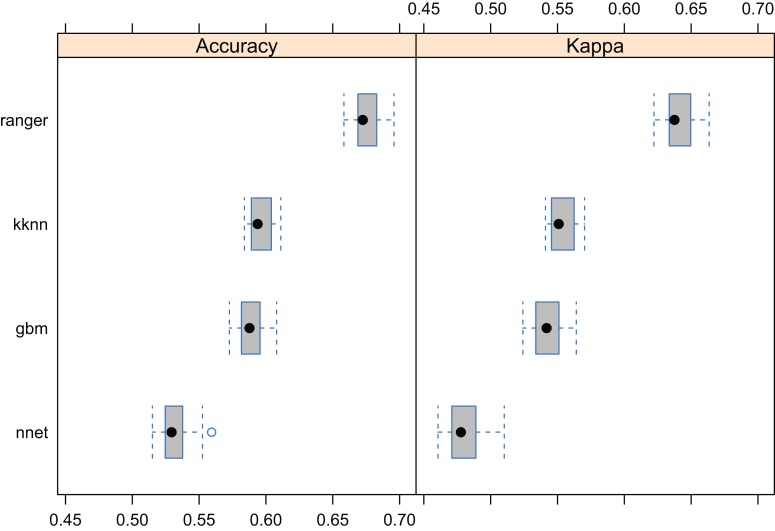
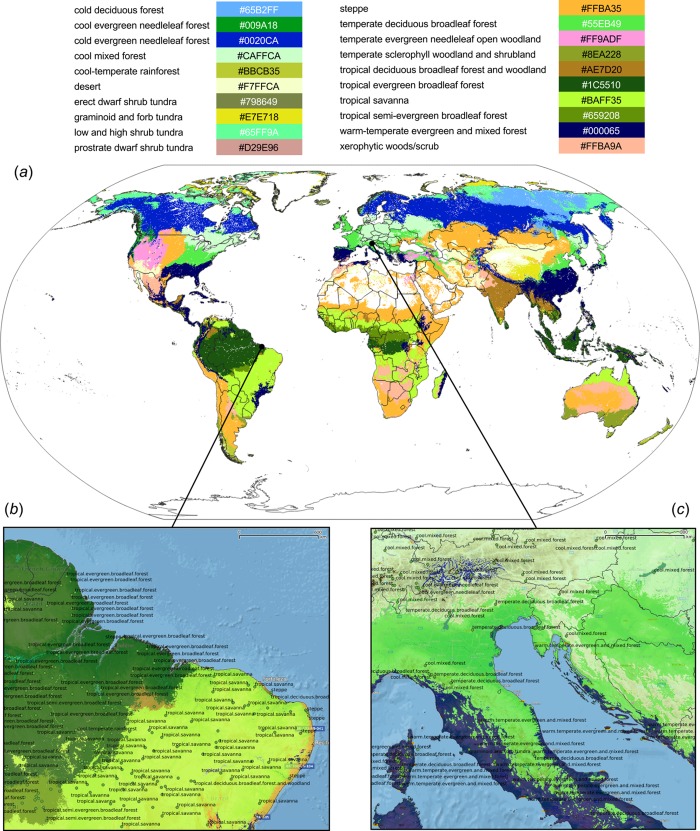
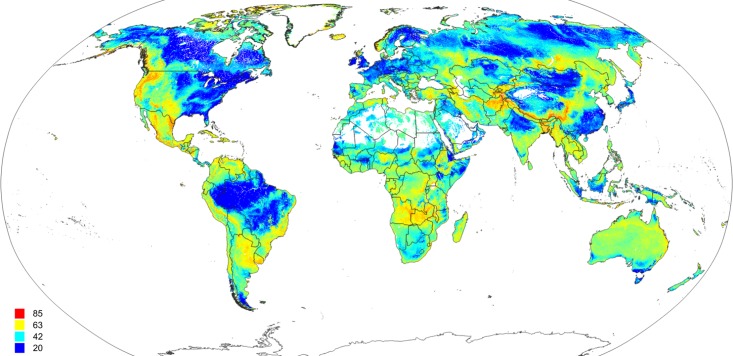
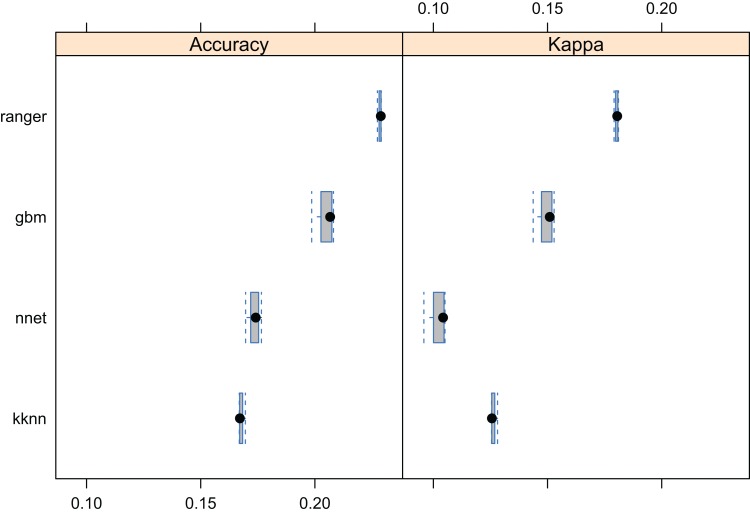
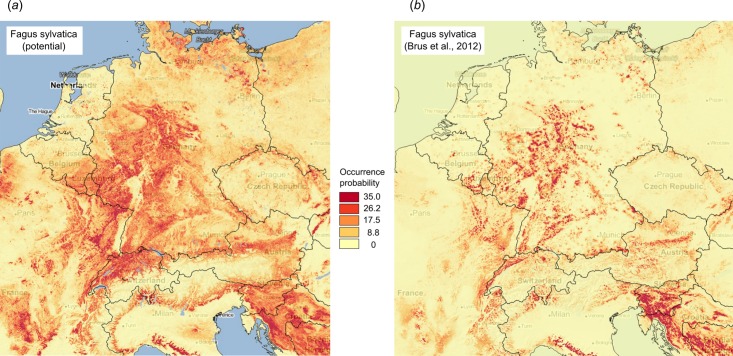
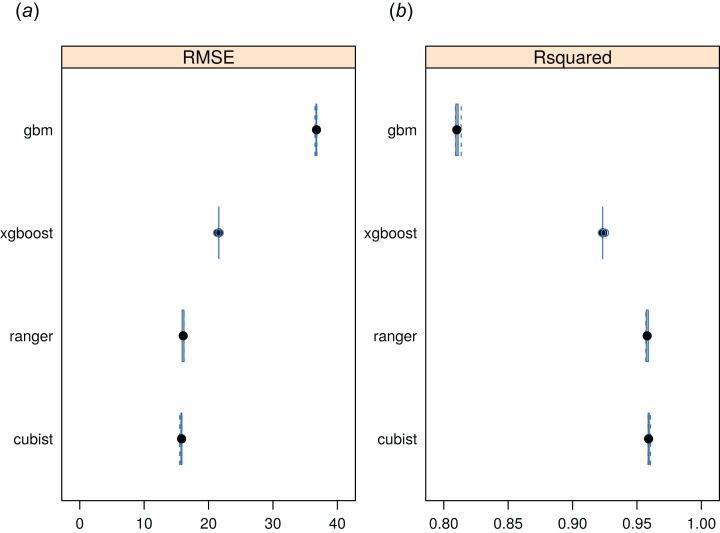
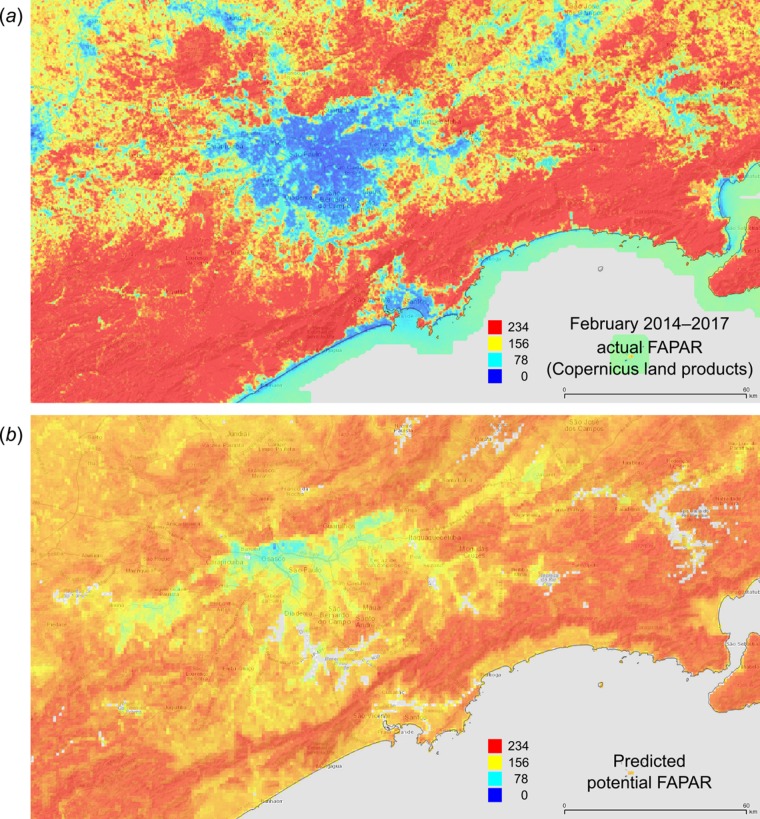
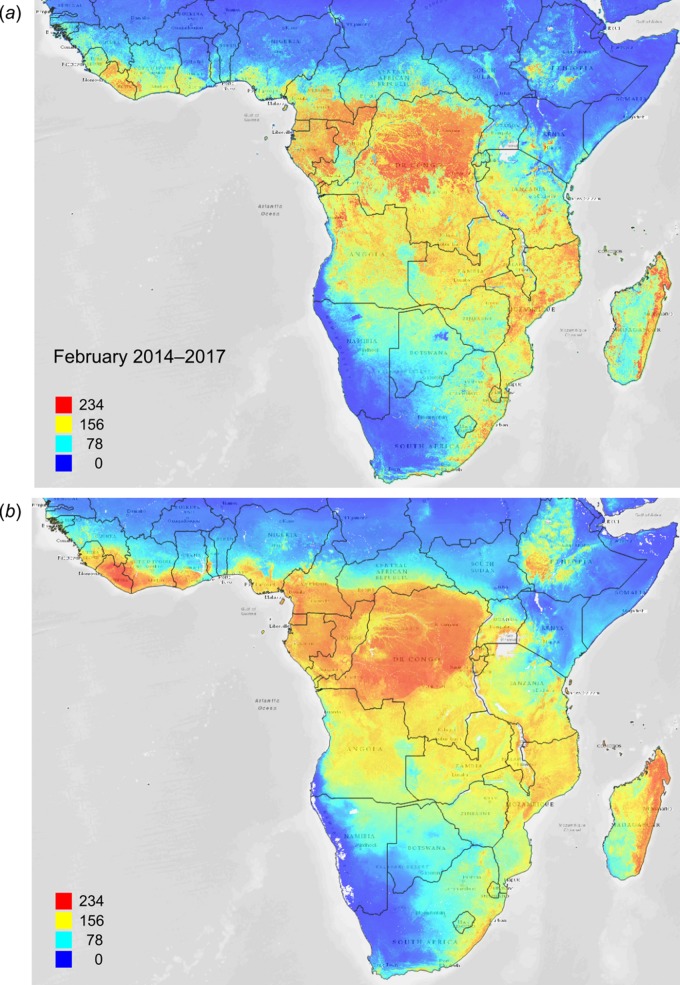
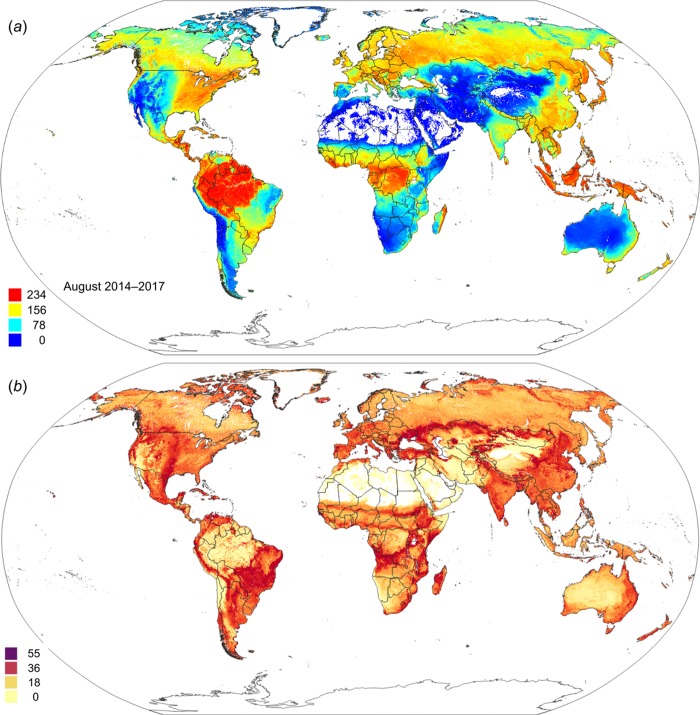
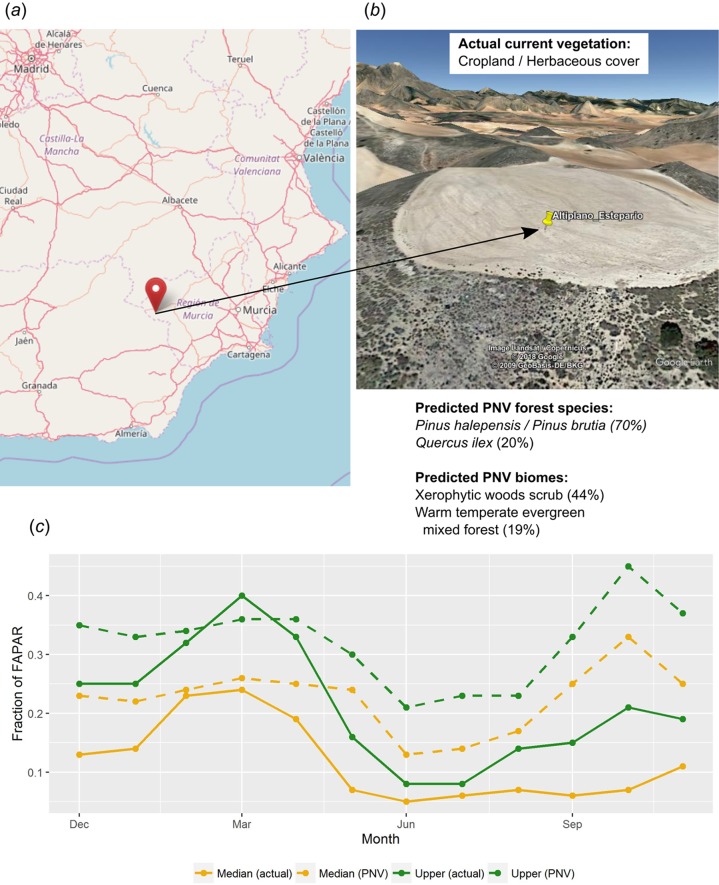
Potential natural vegetation (PNV) is the vegetation cover in equilibrium with climate, that would exist at a given location if not impacted by human activities. PNV is useful for raising public awareness about land degradation and for estimating land potential. This paper presents results of assessing machine learning algorithms-neural networks (nnet package), random forest (ranger), gradient boosting (gbm), K-nearest neighborhood (class) and Cubist-for operational mapping of PNV. Three case studies were considered: (1) global distribution of biomes based on the BIOME 6000 data set (8,057 modern pollen-based site reconstructions), (2) distribution of forest tree taxa in Europe based on detailed occurrence records (1,546,435 ground observations), and (3) global monthly fraction of absorbed photosynthetically active radiation (FAPAR) values (30,301 randomly-sampled points). A stack of 160 global maps representing biophysical conditions over land, including atmospheric, climatic, relief, and lithologic variables, were used as explanatory variables. The overall results indicate that random forest gives the overall best performance. The highest accuracy for predicting BIOME 6000 classes (20) was estimated to be between 33% (with spatial cross-validation) and 68% (simple random sub-setting), with the most important predictors being total annual precipitation, monthly temperatures, and bioclimatic layers. Predicting forest tree species (73) resulted in mapping accuracy of 25%, with the most important predictors being monthly cloud fraction, mean annual and monthly temperatures, and elevation. Regression models for FAPAR (monthly images) gave an R-square of 90% with the most important predictors being total annual precipitation, monthly cloud fraction, CHELSA bioclimatic layers, and month of the year, respectively. Further developments of PNV mapping could include using all GBIF records to map the global distribution of plant species at different taxonomic levels. This methodology could also be extended to dynamic modeling of PNV, so that future climate scenarios can be incorporated. Global maps of biomes, FAPAR and tree species at one km spatial resolution are available for download via http://dx.doi.org/10.7910/DVN/QQHCIK.

摘要

潜在自然植被(PNV)是与气候处于平衡状态的植被覆盖,如果不受人类活动影响,它会存在于特定位置。PNV有助于提高公众对土地退化的认识并估算土地潜力。本文展示了评估机器学习算法——神经网络(nnet包)、随机森林(ranger)、梯度提升(gbm)、K近邻(class)和Cubist——用于PNV业务制图的结果。考虑了三个案例研究:(1)基于BIOME 6000数据集(8057个基于现代花粉的地点重建)的生物群落全球分布,(2)基于详细出现记录(1546435条地面观测)的欧洲森林树种分布,以及(3)全球每月光合有效辐射吸收比例(FAPAR)值(30301个随机采样点)。一组160张代表陆地生物物理条件的全球地图,包括大气、气候、地形和岩性变量,被用作解释变量。总体结果表明随机森林的整体表现最佳。预测BIOME 6000类别(20个)的最高准确率估计在33%(空间交叉验证)至68%(简单随机子集划分)之间,最重要的预测因子是年总降水量、月气温和生物气候层。预测森林树种(73种)的制图准确率为25%,最重要的预测因子是月云量、年平均和月气温以及海拔。FAPAR(月度图像)的回归模型决定系数为90%,最重要的预测因子分别是年总降水量、月云量、CHELSA生物气候层和年份月份。PNV制图的进一步发展可能包括使用所有GBIF记录来绘制不同分类水平植物物种的全球分布。该方法还可扩展到PNV的动态建模,以便纳入未来气候情景。通过http://dx.doi.org/10.7910/DVN/QQHCIK可下载一千米空间分辨率的生物群落、FAPAR和树种全球地图。

https://cdn.ncbi.nlm.nih.gov/pmc/blobs/091e/6109375/fd5dd86eaf67/peerj-06-5457-g016.jpg
https://cdn.ncbi.nlm.nih.gov/pmc/blobs/091e/6109375/5ed6e8293f7d/peerj-06-5457-g001.jpg
https://cdn.ncbi.nlm.nih.gov/pmc/blobs/091e/6109375/76d77b5ad638/peerj-06-5457-g002.jpg
https://cdn.ncbi.nlm.nih.gov/pmc/blobs/091e/6109375/b3de4436d4ab/peerj-06-5457-g003.jpg
https://cdn.ncbi.nlm.nih.gov/pmc/blobs/091e/6109375/cdabe67ea2a0/peerj-06-5457-g004.jpg
https://cdn.ncbi.nlm.nih.gov/pmc/blobs/091e/6109375/237b326eef3d/peerj-06-5457-g005.jpg
https://cdn.ncbi.nlm.nih.gov/pmc/blobs/091e/6109375/0c9cd560fae0/peerj-06-5457-g006.jpg
https://cdn.ncbi.nlm.nih.gov/pmc/blobs/091e/6109375/6a4789b99c74/peerj-06-5457-g007.jpg
https://cdn.ncbi.nlm.nih.gov/pmc/blobs/091e/6109375/7614c6d4bf2d/peerj-06-5457-g008.jpg
https://cdn.ncbi.nlm.nih.gov/pmc/blobs/091e/6109375/f812bd3b8173/peerj-06-5457-g009.jpg
https://cdn.ncbi.nlm.nih.gov/pmc/blobs/091e/6109375/f33de0912356/peerj-06-5457-g010.jpg
https://cdn.ncbi.nlm.nih.gov/pmc/blobs/091e/6109375/fb75ff47c315/peerj-06-5457-g011.jpg
https://cdn.ncbi.nlm.nih.gov/pmc/blobs/091e/6109375/fdcc239bc7bc/peerj-06-5457-g012.jpg
https://cdn.ncbi.nlm.nih.gov/pmc/blobs/091e/6109375/4537e6b14c21/peerj-06-5457-g013.jpg
https://cdn.ncbi.nlm.nih.gov/pmc/blobs/091e/6109375/580b91e7f44c/peerj-06-5457-g014.jpg
https://cdn.ncbi.nlm.nih.gov/pmc/blobs/091e/6109375/4a1a09a85047/peerj-06-5457-g015.jpg
https://cdn.ncbi.nlm.nih.gov/pmc/blobs/091e/6109375/fd5dd86eaf67/peerj-06-5457-g016.jpg

相似文献

1
Global mapping of potential natural vegetation: an assessment of machine learning algorithms for estimating land potential.潜在自然植被的全球制图:用于估算土地潜力的机器学习算法评估
PeerJ. 2018 Aug 22;6:e5457. doi: 10.7717/peerj.5457. eCollection 2018.
2
Land potential assessment and trend-analysis using 2000-2021 FAPAR monthly time-series at 250 m spatial resolution.利用 2000-2021 年每月 FAPAR 时间序列数据(空间分辨率为 250 米)进行土地潜力评估和趋势分析。
PeerJ. 2024 Mar 13;12:e16972. doi: 10.7717/peerj.16972. eCollection 2024.
3
Biomes of the world under climate change scenarios: increasing aridity and higher temperatures lead to significant shifts in natural vegetation.气候变化情景下的世界生物群系:干旱加剧和气温升高导致自然植被发生重大转变。
PeerJ. 2023 Jun 23;11:e15593. doi: 10.7717/peerj.15593. eCollection 2023.
4
Forest tree species distribution for Europe 2000-2020: mapping potential and realized distributions using spatiotemporal machine learning.2000-2020 年欧洲森林树种分布:利用时空机器学习绘制潜在和实现分布的地图。
PeerJ. 2022 Jul 25;10:e13728. doi: 10.7717/peerj.13728. eCollection 2022.
5
Predictive pollen-based biome modeling using machine learning.基于机器学习的预测花粉生物群落建模。
PLoS One. 2018 Aug 23;13(8):e0202214. doi: 10.1371/journal.pone.0202214. eCollection 2018.
6
Quantifying Fundamental Vegetation Traits over Europe Using the Sentinel-3 OLCI Catalogue in Google Earth Engine.利用谷歌地球引擎中的哨兵-3 OLCI目录对欧洲的基本植被特征进行量化。
Remote Sens (Basel). 2022 Mar 10;14(6):1347. doi: 10.3390/rs14061347.
7
Constraining modelled global vegetation dynamics and carbon turnover using multiple satellite observations.利用多颗卫星观测数据来约束全球植被动态和碳周转的模型化研究。
Sci Rep. 2019 Dec 10;9(1):18757. doi: 10.1038/s41598-019-55187-7.
8
Global tropical dry forest extent and cover: A comparative study of bioclimatic definitions using two climatic data sets.全球热带干旱林的范围和覆盖:使用两种气候数据集的生物气候定义比较研究。
PLoS One. 2021 May 20;16(5):e0252063. doi: 10.1371/journal.pone.0252063. eCollection 2021.
9
Machine learning approaches for estimation of the fraction of absorbed photosynthetically active radiation and net photosynthesis rate of maize using multi-spectral sensor.利用多光谱传感器估算玉米光合有效辐射吸收比例和净光合速率的机器学习方法
Heliyon. 2024 Jul 4;10(13):e34117. doi: 10.1016/j.heliyon.2024.e34117. eCollection 2024 Jul 15.
10
[Pheno-climatic profiles of vegetation based on multitemporal analysis of satellite data].基于卫星数据多时态分析的植被物候-气候特征
Parassitologia. 2004 Jun;46(1-2):63-6.

引用本文的文献

1
Massive losses and gains of northern land carbon stocks since the Last Glacial Maximum.自末次盛冰期以来北半球陆地碳储量的巨大增减。
Sci Adv. 2025 Aug 29;11(35):eadt6231. doi: 10.1126/sciadv.adt6231.
2
Climate, vegetation, people: disentangling the controls of fire at different timescales.气候、植被、人类:厘清不同时间尺度下火灾的控制因素
Philos Trans R Soc Lond B Biol Sci. 2025 Apr;380(1924):20230464. doi: 10.1098/rstb.2023.0464. Epub 2025 Apr 17.
3
Potential tree cover under current and future climate scenarios.当前和未来气候情景下的潜在树木覆盖情况。

本文引用的文献

1
Random forest as a generic framework for predictive modeling of spatial and spatio-temporal variables.随机森林作为空间和时空变量预测建模的通用框架。
PeerJ. 2018 Aug 29;6:e5518. doi: 10.7717/peerj.5518. eCollection 2018.
2
Unexpectedly large impact of forest management and grazing on global vegetation biomass.森林管理和放牧对全球植被生物量的影响出乎意料地大。
Nature. 2018 Jan 4;553(7686):73-76. doi: 10.1038/nature25138. Epub 2017 Dec 20.
3
Natural climate solutions.自然气候解决方案。
Sci Data. 2025 Apr 3;12(1):564. doi: 10.1038/s41597-025-04408-y.
4
Macroecology of Abiotic Stress Tolerance in Woody Plants of the Northern Hemisphere: Tolerance Biomes and Polytolerance Hotspots.北半球木本植物非生物胁迫耐受性的宏观生态学:耐受性生物群落与多耐受性热点地区
Ecol Lett. 2024 Nov;27(11):e70016. doi: 10.1111/ele.70016.
5
Landscape-Scale Biodiversity Impacts Analysis of Côte d'Ivoire's Cocoa Cultivation along Export Supply Chains.科特迪瓦出口供应链沿线可可种植的景观尺度生物多样性影响分析。
Environ Sci Technol. 2024 Jun 4;58(22):9601-9611. doi: 10.1021/acs.est.3c07795. Epub 2024 May 18.
6
The anthropogenic imprint on temperate and boreal forest demography and carbon turnover.人类活动对温带和北方森林人口统计学及碳周转的影响。
Glob Ecol Biogeogr. 2024 Jan;33(1):100-115. doi: 10.1111/geb.13773. Epub 2023 Oct 16.
7
Land potential assessment and trend-analysis using 2000-2021 FAPAR monthly time-series at 250 m spatial resolution.利用 2000-2021 年每月 FAPAR 时间序列数据(空间分辨率为 250 米)进行土地潜力评估和趋势分析。
PeerJ. 2024 Mar 13;12:e16972. doi: 10.7717/peerj.16972. eCollection 2024.
8
Reassessment of the risks of climate change for terrestrial ecosystems.气候变化对陆地生态系统风险的再评估。
Nat Ecol Evol. 2024 May;8(5):888-900. doi: 10.1038/s41559-024-02333-8. Epub 2024 Feb 26.
9
Quo vadis, smallholder forest landscape? An introduction to the LPB-RAP model.小农户森林景观走向何方?LPB-RAP 模型简介。
PLoS One. 2024 Feb 2;19(2):e0297439. doi: 10.1371/journal.pone.0297439. eCollection 2024.
10
Empirical delineation of the forest-steppe zone is supported by macroclimate.森林草原带的经验性划定得到了大气候的支持。
Sci Rep. 2023 Oct 13;13(1):17379. doi: 10.1038/s41598-023-44221-4.
Proc Natl Acad Sci U S A. 2017 Oct 31;114(44):11645-11650. doi: 10.1073/pnas.1710465114. Epub 2017 Oct 16.
4
Climatologies at high resolution for the earth's land surface areas.高分辨率地球陆地区域气候概况。
Sci Data. 2017 Sep 5;4:170122. doi: 10.1038/sdata.2017.122.
5
EU-Forest, a high-resolution tree occurrence dataset for Europe.EU-Forest,一个用于欧洲的高分辨率树木出现数据集。
Sci Data. 2017 Jan 5;4:160123. doi: 10.1038/sdata.2016.123.
6
Biodiversity data obsolescence and land uses changes.生物多样性数据过时与土地利用变化。
PeerJ. 2016 Dec 13;4:e2743. doi: 10.7717/peerj.2743. eCollection 2016.
7
High-resolution mapping of global surface water and its long-term changes.高分辨率绘制全球地表水及其长期变化图。
Nature. 2016 Dec 15;540(7633):418-422. doi: 10.1038/nature20584. Epub 2016 Dec 7.
8
Has land use pushed terrestrial biodiversity beyond the planetary boundary? A global assessment.土地利用是否使陆地生物多样性超出了行星边界?一项全球评估。
Science. 2016 Jul 15;353(6296):288-91. doi: 10.1126/science.aaf2201.
9
Multidimensional biases, gaps and uncertainties in global plant occurrence information.全球植物分布信息中的多维偏差、差距和不确定性。
Ecol Lett. 2016 Aug;19(8):992-1006. doi: 10.1111/ele.12624. Epub 2016 Jun 2.
10
Remotely Sensed High-Resolution Global Cloud Dynamics for Predicting Ecosystem and Biodiversity Distributions.用于预测生态系统和生物多样性分布的遥感高分辨率全球云动力学
PLoS Biol. 2016 Mar 31;14(3):e1002415. doi: 10.1371/journal.pbio.1002415. eCollection 2016 Mar.