Laboratory of Geo-Information Science and Remote Sensing, Wageningen University and Research, Wageningen, The Netherlands.
OpenGeoHub, Wageningen, The Netherlands.
PeerJ. 2022 Jul 25;10:e13728. doi: 10.7717/peerj.13728. eCollection 2022.
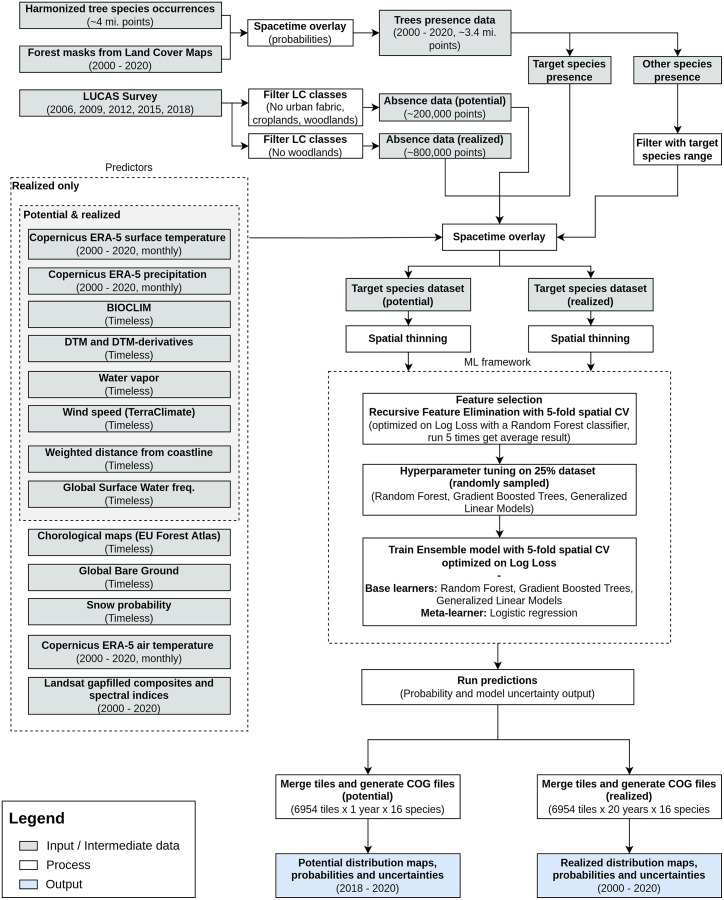
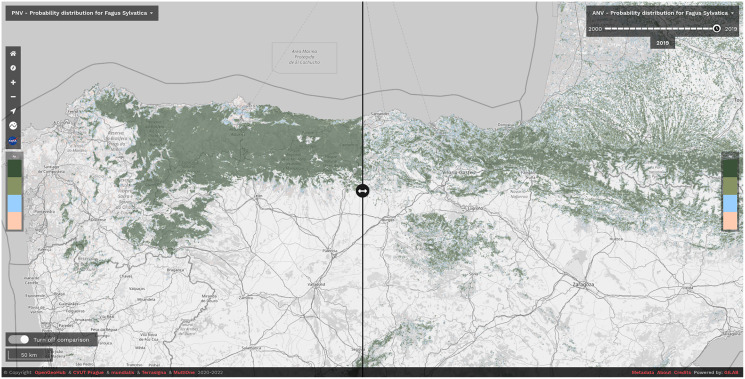
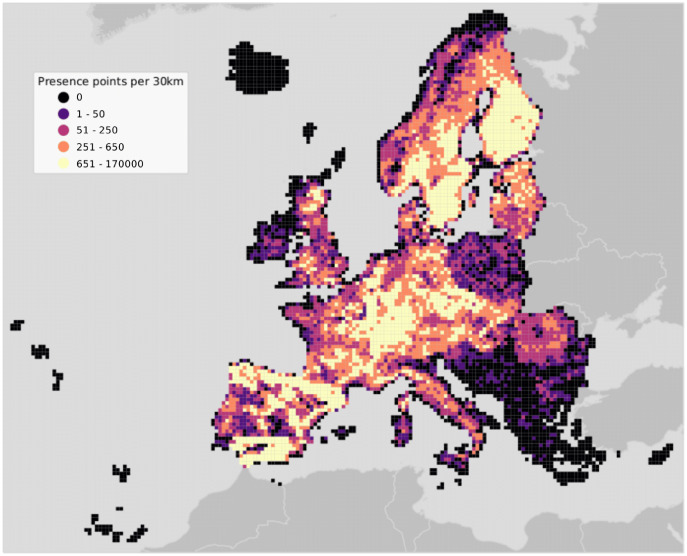
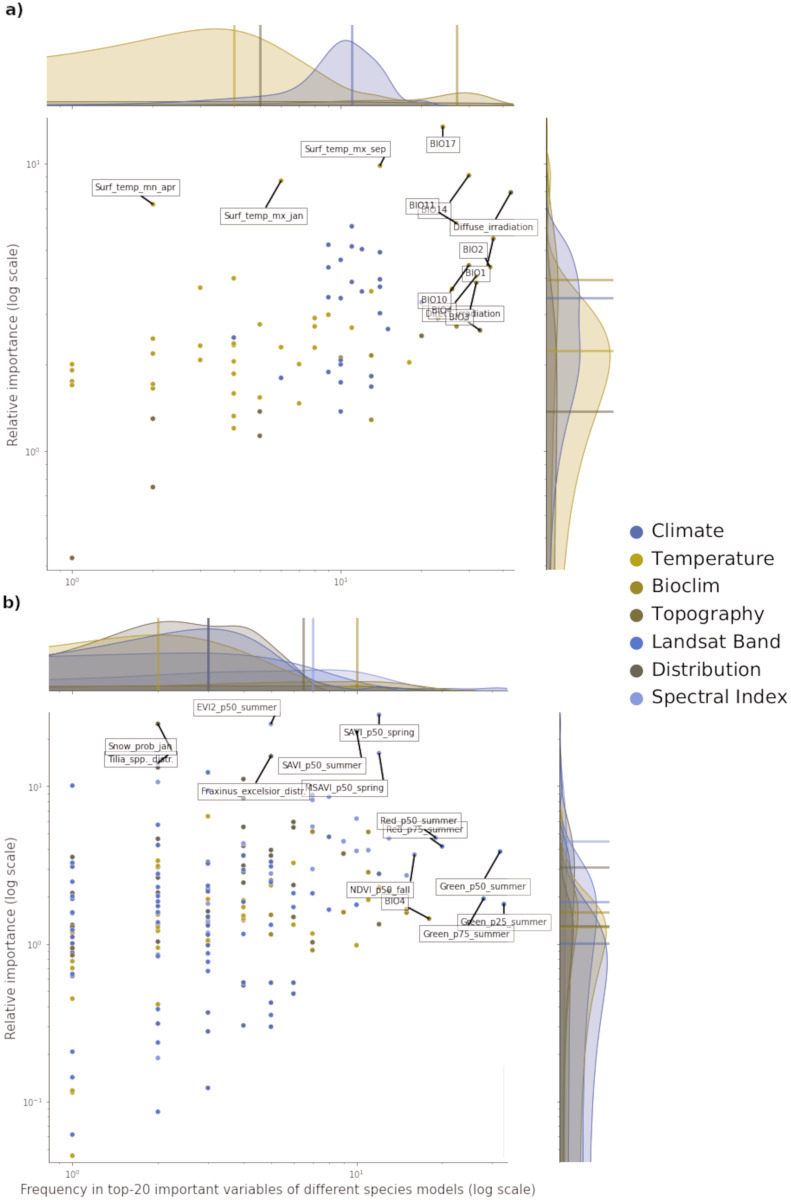
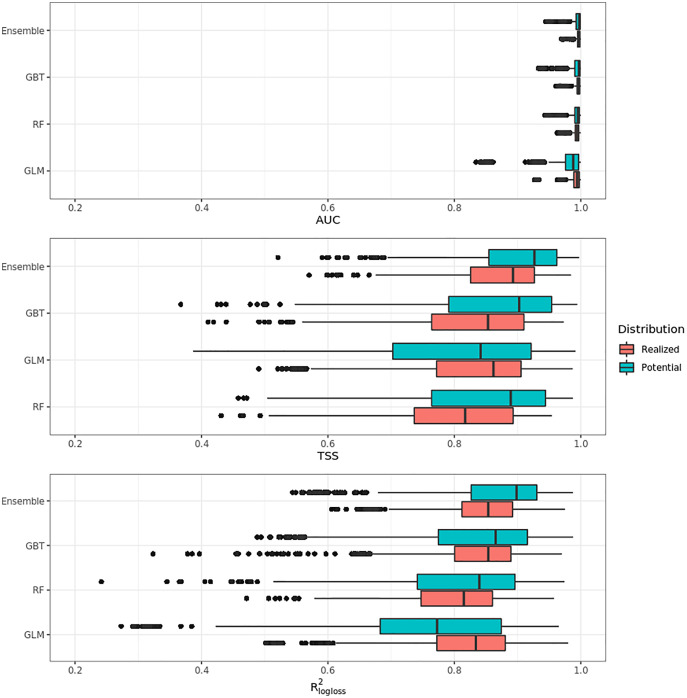
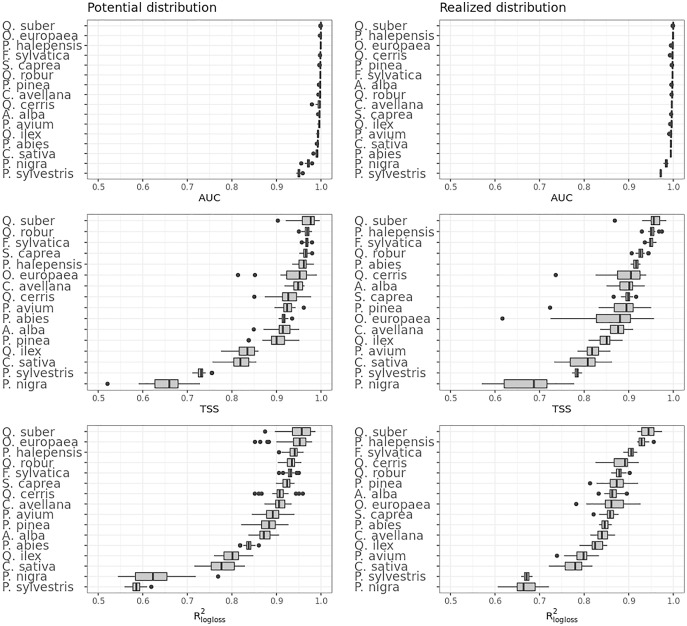
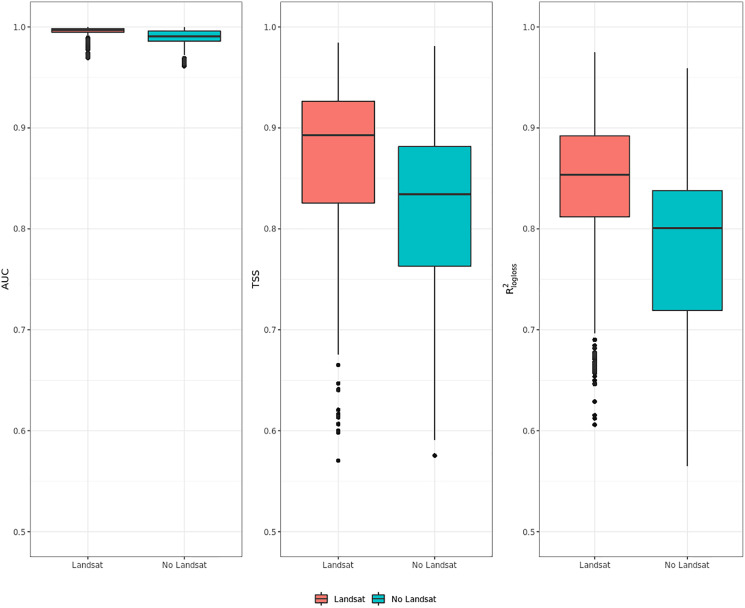
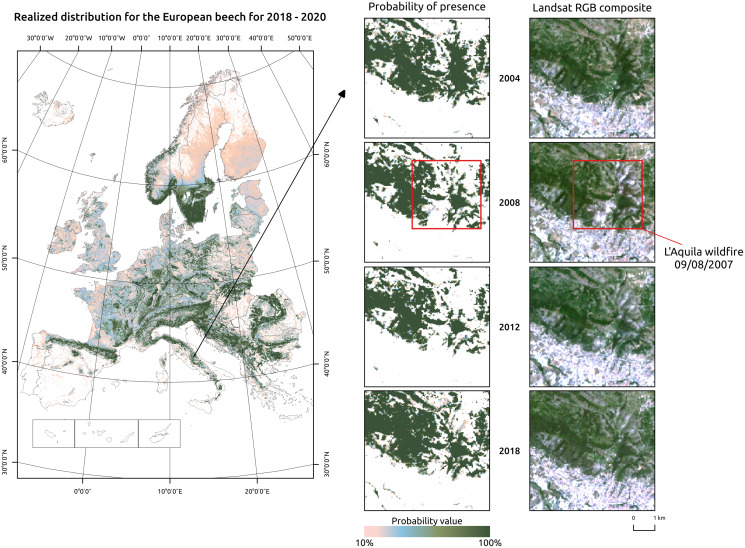
This article describes a data-driven framework based on spatiotemporal machine learning to produce distribution maps for 16 tree species ( Mill., Mill., L., L., L., L. H. Karst., Mill., J. F. Arnold, L., L., L., L., L., L., L. and L.) at high spatial resolution (30 m). Tree occurrence data for a total of three million of points was used to train different algorithms: random forest, gradient-boosted trees, generalized linear models, k-nearest neighbors, CART and an artificial neural network. A stack of 305 coarse and high resolution covariates representing spectral reflectance, different biophysical conditions and biotic competition was used as predictors for realized distributions, while potential distribution was modelled with environmental predictors only. Logloss and computing time were used to select the three best algorithms to tune and train an ensemble model based on stacking with a logistic regressor as a meta-learner. An ensemble model was trained for each species: probability and model uncertainty maps of realized distribution were produced for each species using a time window of 4 years for a total of six distribution maps per species, while for potential distributions only one map per species was produced. Results of spatial cross validation show that the ensemble model consistently outperformed or performed as good as the best individual model in both potential and realized distribution tasks, with potential distribution models achieving higher predictive performances (TSS = 0.898, R = 0.857) than realized distribution ones on average (TSS = 0.874, R = 0.839). Ensemble models for achieved the best performances in both potential (TSS = 0.968, R = 0.952) and realized (TSS = 0.959, R = 0.949) distribution, while (TSS = 0.731, 0.785, R = 0.585, 0.670, respectively, for potential and realized distribution) and (TSS = 0.658, 0.686, R = 0.623, 0.664) achieved the worst. Importance of predictor variables differed across species and models, with the green band for summer and the Normalized Difference Vegetation Index (NDVI) for fall for realized distribution and the diffuse irradiation and precipitation of the driest quarter (BIO17) being the most frequent and important for potential distribution. On average, fine-resolution models outperformed coarse resolution models (250 m) for realized distribution (TSS = +6.5%, R = +7.5%). The framework shows how combining continuous and consistent Earth Observation time series data with state of the art machine learning can be used to derive dynamic distribution maps. The produced predictions can be used to quantify temporal trends of potential forest degradation and species composition change.
这篇文章描述了一个基于时空机器学习的数据驱动框架,用于以高空间分辨率(30 米)生成 16 种树种(Mill.,Mill.,L.,L.,L.,L. H. Karst.,Mill.,J. F. Arnold,L.,L.,L.,L.,L.,L.,L.和 L.)的分布图。总共使用了三百万个点的树木发生数据来训练不同的算法:随机森林、梯度提升树、广义线性模型、k-最近邻、CART 和人工神经网络。使用堆叠的 305 个粗分辨率和高分辨率协变量来表示光谱反射率、不同的生物物理条件和生物竞争,作为实现分布的预测因子,而潜在分布仅使用环境预测因子进行建模。对数损失和计算时间用于选择三个最佳算法,以调整和训练基于堆叠的集成模型,其中逻辑回归器作为元学习者。为每个物种训练了一个集成模型:使用 4 年的时间窗口为每个物种生成实现分布的概率和模型不确定性图,总共为每个物种生成 6 个分布图,而对于潜在分布,每个物种仅生成一个图。空间交叉验证结果表明,集成模型在潜在和实现分布任务中始终优于或表现与最佳单个模型一样好,潜在分布模型的预测性能更高(TSS = 0.898,R = 0.857)平均而言,实现分布模型的预测性能(TSS = 0.874,R = 0.839)。在潜在(TSS = 0.968,R = 0.952)和实现(TSS = 0.959,R = 0.949)分布方面,实现了最佳性能,而 (TSS = 0.731,0.785,R = 0.585,0.670,分别为潜在和实现分布)和 (TSS = 0.658,0.686,R = 0.623,0.664)的表现最差。预测因子的重要性因物种和模型而异,对于实现分布,夏季的绿光波段和秋季的归一化差异植被指数(NDVI)以及漫射辐射和最干旱季度的降水(BIO17)是最常见和最重要的,而对于潜在分布则是最常见和最重要的。平均而言,细分辨率模型在实现分布方面优于粗分辨率模型(250 米)(TSS = +6.5%,R = +7.5%)。该框架展示了如何结合连续一致的地球观测时间序列数据和最先进的机器学习,用于生成动态分布图。生成的预测可用于量化潜在森林退化和物种组成变化的时间趋势。