College of Geoscience and Surveying Engineering, China University of Mining & Technology, Beijing 100083, China.
State Key Laboratory of Resources and Environmental Information System, Institute of Geographical Sciences and Natural Resources Research, Chinese Academy of Sciences, Beijing 100101, China.
Int J Environ Res Public Health. 2019 Feb 22;16(4):648. doi: 10.3390/ijerph16040648.
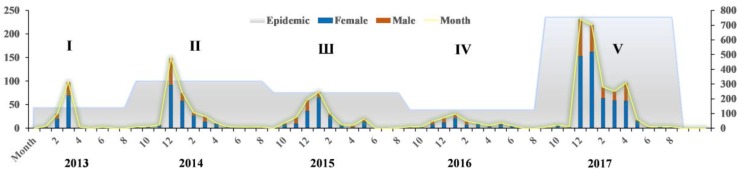
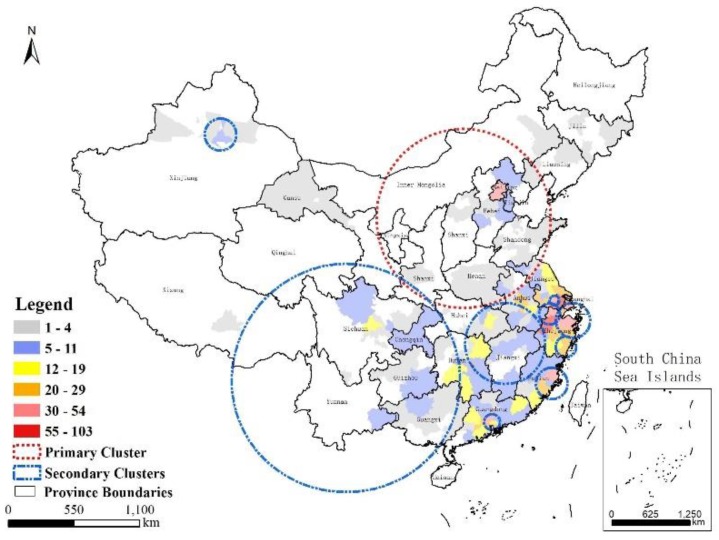
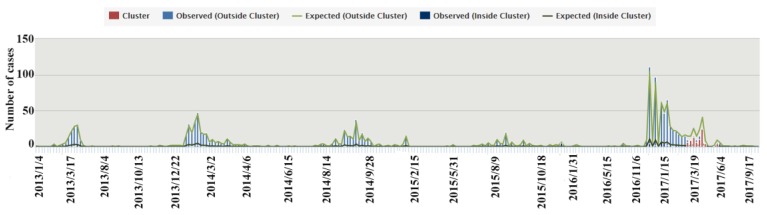
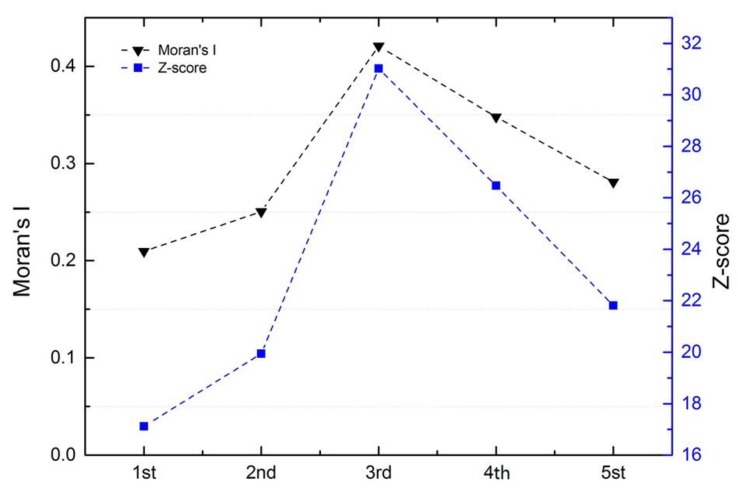
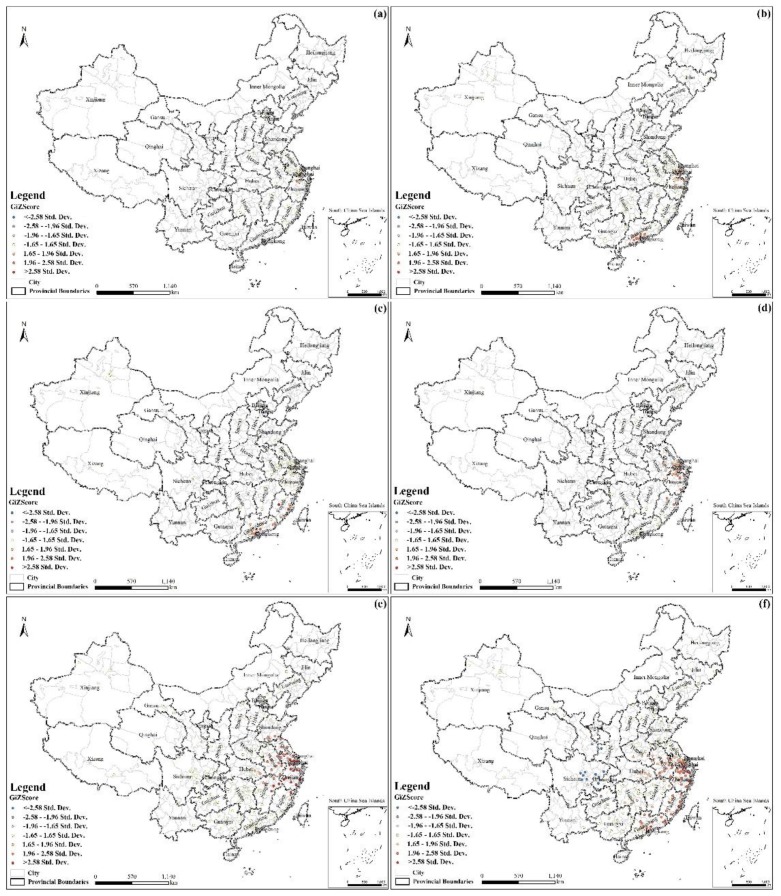
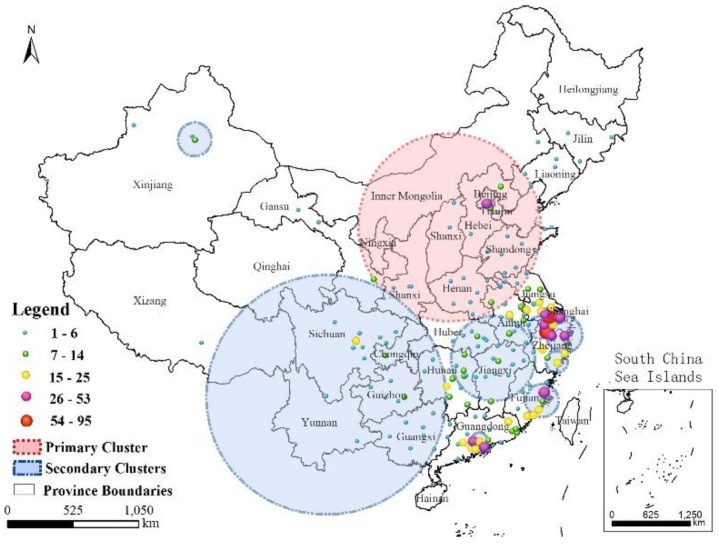
This study aims to describe the spatial and temporal characteristics of human infections with H7N9 virus in China using data from 19 February 2013 to 30 September 2017 extracted from Centre for Health Protection of the Department of Health (CHP) and electronic databases managed by China's Center for Disease Control (CDC) and provincial CDCs synthetically using the Geographic Information System (GIS) software ArcMap™ 10.2 and SaTScan. Based on the multiple analyses of the A(H7N9) epidemics, there was a strong seasonal pattern in A(H7N9) virus infection, with high activity in the first quarter of the year, especially in January, February, and April, and a gradual dying out in the third quarter. Spatial distribution analysis indicated that Eastern China contained the most severely affected areas, such as Zhejiang Province, and the distribution shifted from coastline areas to more inland areas over time. In addition, the cases exhibited local spatial aggregation, with high-risk areas most found in the southeast coastal regions of China. Shanghai, Jiangsu, Zhejiang, and Guangdong were the high-risk epidemic areas, which should arouse the attention of local governments. A strong cluster from 9 April 2017 to 24 June 2017 was also identified in Northern China, and there were many secondary clusters in Eastern and Southern China, especially in Zhejiang, Fujian, Jiangsu, and Guangdong Provinces. Our results suggested that the spatial-temporal clustering of H7N9 in China is fundamentally different, and is expected to contribute to accumulating knowledge on the changing temporal patterns and spatial dissemination during the fifth epidemic and provide data to enable adequate preparation against the next epidemic.
本研究旨在利用 2013 年 2 月 19 日至 2017 年 9 月 30 日期间从香港卫生防护中心(CHP)和中国疾病预防控制中心(CDC)管理的电子数据库中提取的数据,使用地理信息系统(GIS)软件 ArcMap™ 10.2 和 SaTScan 综合描述中国人间感染 H7N9 病毒的时空特征。基于对 A(H7N9)疫情的多次分析,A(H7N9)病毒感染具有明显的季节性模式,活动高峰在第一季度,尤其是 1 月、2 月和 4 月,然后在第三季度逐渐减少。空间分布分析表明,华东地区受影响最严重,如浙江省,分布随时间从沿海地区向内陆地区转移。此外,病例呈局部空间聚集性,高危地区主要在中国东南沿海地区。上海、江苏、浙江和广东是高风险疫区,应引起地方政府的重视。2017 年 4 月 9 日至 6 月 24 日期间,中国北方还发现了一个强烈的聚集区,华东和华南地区也有许多次级聚集区,特别是在浙江、福建、江苏和广东省。我们的结果表明,中国 H7N9 的时空聚类存在根本差异,有望为积累第五次疫情期间时间模式变化和空间传播的知识做出贡献,并为下一次疫情提供数据,以便做好充分准备。