Monterey Bay Aquarium, Monterey, California, United States of America.
NOAA Pacific Islands Fisheries Science Center, Ecosystem Sciences Division, Honolulu, Hawaii United States of America.
PLoS One. 2019 Apr 24;14(4):e0214972. doi: 10.1371/journal.pone.0214972. eCollection 2019.
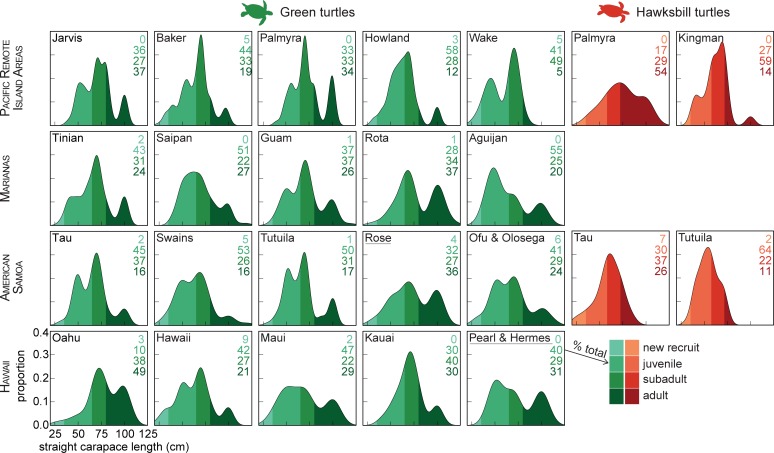
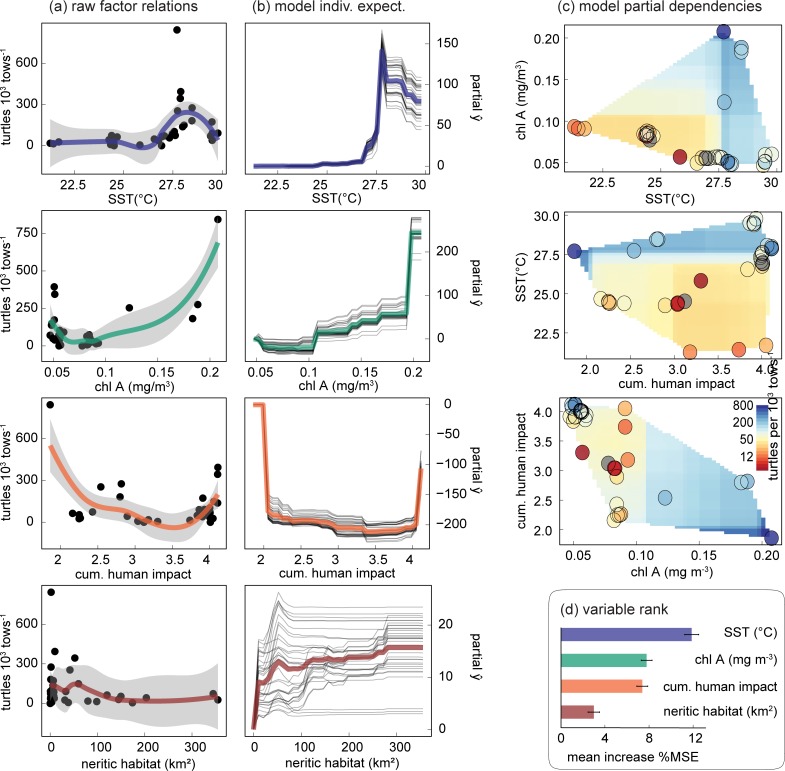
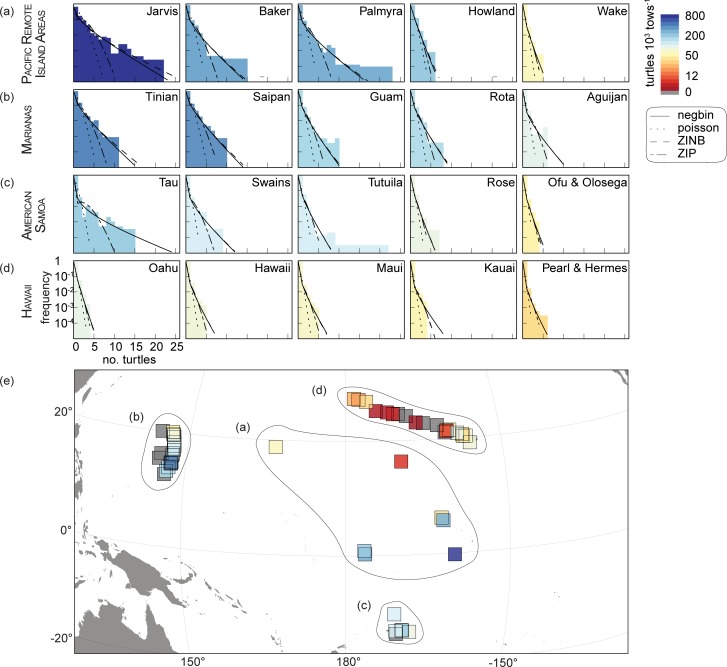
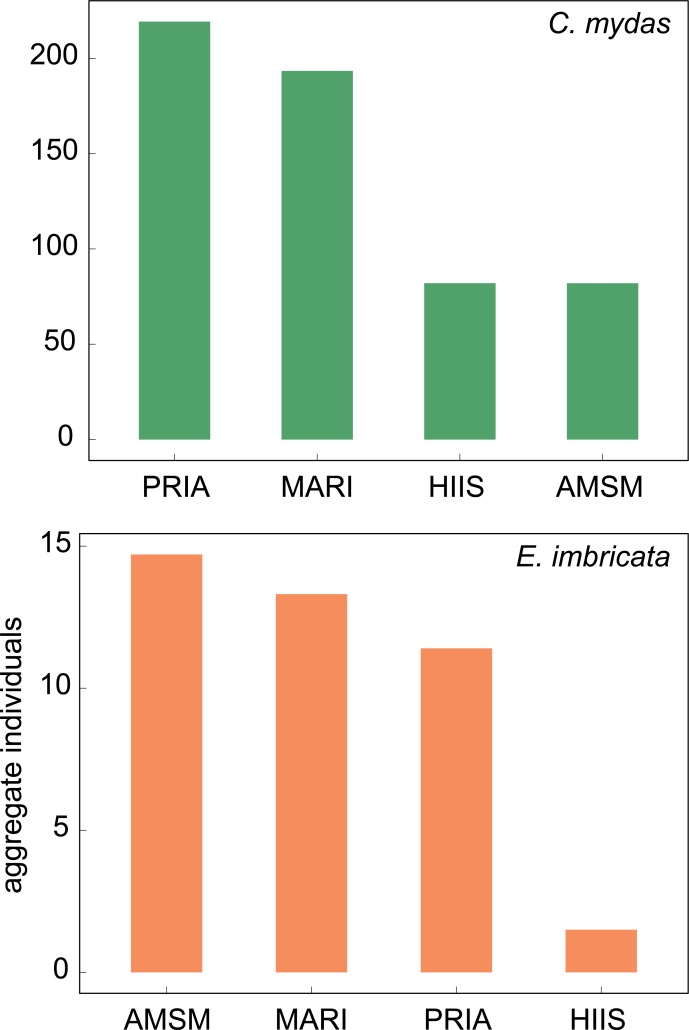
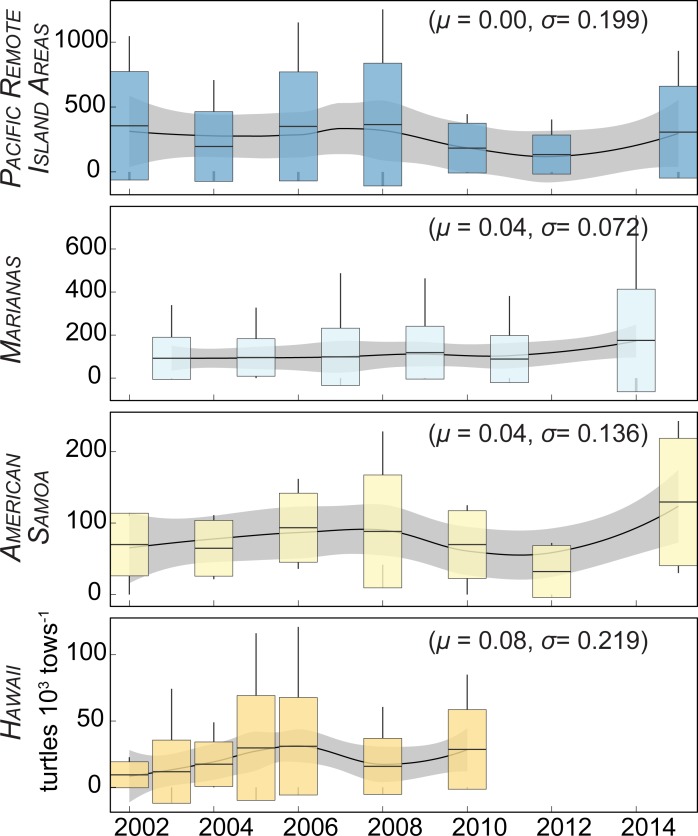
Sea turtle populations are often assessed at the regional to sub-basin scale from discrete indices of nesting abundance. While this may be practical and sometimes effective, widespread in-water surveys may enhance assessments by including additional demographics, locations, and revealing emerging population trends. Here, we describe sea turtle observations from 13 years of towed-diver surveys across 53 coral islands, atolls, and reefs in the Central, West, and South Pacific. These surveys covered more than 7,300 linear km, and observed more than 3,400 green (Chelonia mydas) and hawksbill (Eretmochelys imbricata) sea turtles. From these data, we estimated sea turtle densities, described trends across space and time, and modelled the influence of environmental and anthropogenic drivers. Both species were patchily distributed across spatial scales, and green turtles were 11 times more abundant than hawksbills. The Pacific Remote Island Areas had the highest densities of greens (3.62 turtles km-1, Jarvis Island), while American Samoa had the most hawksbills (0.12 turtles km-1, Ta'u Island). The Hawaiian Islands had the lowest turtle densities (island ave = 0.07 turtles km-1) yet the highest annual population growth (μ = 0.08, σ = 0.22), suggesting extensive management protections can yield positive conservation results. Densities peaked at 27.5°C SST, in areas of high productivity and low human impact, and were consistent with patterns of historic overexploitation. Though such intensive surveys have great value, they are logistically demanding and therefore have an uncertain budget and programmatic future. We hope the methods we described here may be applied to future comparatively low-cost surveys either with autonomous vehicles or with environmental DNA.
海龟种群通常在区域到亚盆的尺度上,通过离散的筑巢丰度指数进行评估。虽然这种方法在实践中可能是可行的,有时也是有效的,但广泛的水上调查可以通过包括更多的人口统计数据、地点,并揭示新的种群趋势,从而增强评估效果。在这里,我们描述了从 13 年的拖曳潜水员调查中获得的中太平洋、西太平洋和南太平洋 53 个珊瑚岛、环礁和珊瑚礁的海龟观测结果。这些调查覆盖了超过 7300 公里的线性距离,观察到了超过 3400 只绿海龟(Chelonia mydas)和玳瑁(Eretmochelys imbricata)。根据这些数据,我们估计了海龟的密度,描述了空间和时间上的趋势,并对环境和人为驱动因素的影响进行了建模。这两个物种在空间尺度上呈斑块状分布,绿海龟的数量是玳瑁的 11 倍。太平洋偏远岛屿地区的绿海龟密度最高(3.62 只/公里,贾维斯岛),而美属萨摩亚的玳瑁密度最高(0.12 只/公里,塔乌岛)。夏威夷群岛的海龟密度最低(岛屿平均值=0.07 只/公里),但种群增长率最高(μ=0.08,σ=0.22),这表明广泛的管理保护措施可以产生积极的保护效果。在 27.5°C 的 SST 下,在高生产力和低人类影响的区域,海龟的密度达到峰值,与历史上过度捕捞的模式一致。虽然这种密集的调查具有很高的价值,但它们在后勤上要求很高,因此预算和项目未来具有不确定性。我们希望我们在这里描述的方法可以应用于未来相对低成本的调查,无论是使用自主车辆还是环境 DNA。