• 文献检索
  • 文档翻译
  • 深度研究
  • 学术资讯
  • Suppr Zotero 插件Zotero 插件
  • 邀请有礼
  • 套餐&价格
  • 历史记录
应用&插件
Suppr Zotero 插件Zotero 插件浏览器插件Mac 客户端Windows 客户端微信小程序
定价
高级版会员购买积分包购买API积分包
服务
文献检索文档翻译深度研究API 文档MCP 服务
关于我们
关于 Suppr公司介绍联系我们用户协议隐私条款
关注我们

Suppr 超能文献

核心技术专利:CN118964589B侵权必究
粤ICP备2023148730 号-1Suppr @ 2026

文献检索

告别复杂PubMed语法,用中文像聊天一样搜索,搜遍4000万医学文献。AI智能推荐,让科研检索更轻松。

立即免费搜索

文件翻译

保留排版,准确专业,支持PDF/Word/PPT等文件格式,支持 12+语言互译。

免费翻译文档

深度研究

AI帮你快速写综述,25分钟生成高质量综述,智能提取关键信息,辅助科研写作。

立即免费体验

使用流行病学模型与机器学习模型识别与美国县一级肥胖患病率变化相关的因素。

Identification of Factors Associated With Variation in US County-Level Obesity Prevalence Rates Using Epidemiologic vs Machine Learning Models.

机构信息

Department of Management Science and Engineering, Stanford University School of Engineering, Stanford, California.

Department of Preoperative Services, Lucile Packard Children's Hospital Stanford, Stanford, California.

出版信息

JAMA Netw Open. 2019 Apr 5;2(4):e192884. doi: 10.1001/jamanetworkopen.2019.2884.

DOI:10.1001/jamanetworkopen.2019.2884
PMID:31026030
原文链接:https://pmc.ncbi.nlm.nih.gov/articles/PMC6487629/
Abstract

IMPORTANCE

Obesity is a leading cause of high health care expenditures, disability, and premature mortality. Previous studies have documented geographic disparities in obesity prevalence.

OBJECTIVE

To identify county-level factors associated with obesity using traditional epidemiologic and machine learning methods.

DESIGN, SETTING, AND PARTICIPANTS: Cross-sectional study using linear regression models and machine learning models to evaluate the associations between county-level obesity and county-level demographic, socioeconomic, health care, and environmental factors from summarized statistical data extracted from the 2018 Robert Wood Johnson Foundation County Health Rankings and merged with US Census data from each of 3138 US counties. The explanatory power of the linear multivariate regression and the top performing machine learning model were compared using mean R2 measured in 30-fold cross validation.

EXPOSURES

County-level demographic factors (population; rural status; census region; and race/ethnicity, sex, and age composition), socioeconomic factors (median income, unemployment rate, and percentage of population with some college education), health care factors (rate of uninsured adults and primary care physicians), and environmental factors (access to healthy foods and access to exercise opportunities).

MAIN OUTCOMES AND MEASURES

County-level obesity prevalence in 2018, its association with each county-level factor, and the percentage of variation in county-level obesity prevalence explained by linear multivariate and gradient boosting machine regression measured with R2.

RESULTS

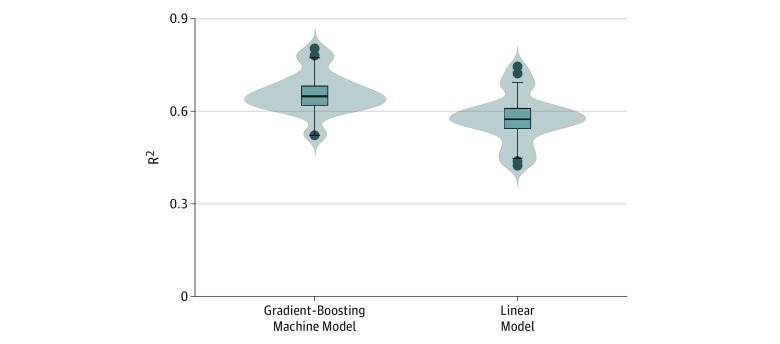
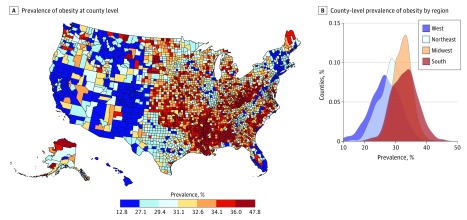
Among the 3138 counties studied, the mean (range) obesity prevalence was 31.5% (12.8%-47.8%). In multivariate regressions, demographic factors explained 44.9% of variation in obesity prevalence; socioeconomic factors, 33.0%; environmental factors, 15.5%; and health care factors, 9.1%. The county-level factors with the strongest association with obesity were census region, median household income, and percentage of population with some college education. R2 values of univariate regressions of obesity prevalence were 0.238 for census region, 0.218 for median household income, and 0.160 for percentage of population with some college education. Multivariate linear regression and gradient boosting machine regression (the best-performing machine learning model) of obesity prevalence using all county-level demographic, socioeconomic, health care, and environmental factors had R2 values of 0.58 and 0.66, respectively (P < .001).

CONCLUSIONS AND RELEVANCE

Obesity prevalence varies significantly between counties. County-level demographic, socioeconomic, health care, and environmental factors explain the majority of variation in county-level obesity prevalence. Using machine learning models may explain significantly more of the variation in obesity prevalence..

https://cdn.ncbi.nlm.nih.gov/pmc/blobs/ce4b/6487629/129e582eb9c0/jamanetwopen-2-e192884-g002.jpg
https://cdn.ncbi.nlm.nih.gov/pmc/blobs/ce4b/6487629/b796be24f430/jamanetwopen-2-e192884-g001.jpg
https://cdn.ncbi.nlm.nih.gov/pmc/blobs/ce4b/6487629/129e582eb9c0/jamanetwopen-2-e192884-g002.jpg
https://cdn.ncbi.nlm.nih.gov/pmc/blobs/ce4b/6487629/b796be24f430/jamanetwopen-2-e192884-g001.jpg
https://cdn.ncbi.nlm.nih.gov/pmc/blobs/ce4b/6487629/129e582eb9c0/jamanetwopen-2-e192884-g002.jpg
摘要

重要性

肥胖是导致高额医疗支出、残疾和过早死亡的主要原因之一。先前的研究记录了肥胖流行在地理上的差异。

目的

使用传统的流行病学和机器学习方法确定与肥胖相关的县级因素。

设计、设置和参与者:使用线性回归模型和机器学习模型的横断面研究,评估从 2018 年罗伯特伍德约翰逊基金会县健康排名中提取的汇总统计数据和与美国每 3138 个县的美国人口普查数据合并的县级肥胖与县级人口统计学、社会经济、医疗保健和环境因素之间的关联。使用 30 折交叉验证测量的平均 R2 比较了线性多元回归和表现最佳的机器学习模型的解释能力。

暴露因素

县级人口统计学因素(人口;农村状况;人口普查区域;以及种族/族裔、性别和年龄构成)、社会经济因素(中位数收入、失业率和具有一定大学教育程度的人口比例)、医疗保健因素(未参保成年人和初级保健医生的比例)和环境因素(获得健康食品和获得锻炼机会的机会)。

主要结果和措施

2018 年县级肥胖流行率,其与每个县级因素的关联,以及线性多元回归和梯度提升机回归测量的县级肥胖流行率变化的百分比用 R2 表示。

结果

在所研究的 3138 个县中,肥胖流行率的平均值(范围)为 31.5%(12.8%-47.8%)。在多元回归中,人口统计学因素解释了肥胖流行率变化的 44.9%;社会经济因素占 33.0%;环境因素占 15.5%;医疗保健因素占 9.1%。与肥胖关系最密切的县级因素是人口普查区、家庭收入中位数和具有一定大学教育程度的人口比例。肥胖流行率的单变量回归的 R2 值分别为人口普查区 0.238、家庭收入中位数 0.218 和具有一定大学教育程度的人口比例 0.160。使用所有县级人口统计学、社会经济、医疗保健和环境因素的肥胖流行率的多元线性回归和梯度提升机回归(表现最佳的机器学习模型)的 R2 值分别为 0.58 和 0.66(P<.001)。

结论和相关性

县与县之间的肥胖流行率差异显著。县级人口统计学、社会经济、医疗保健和环境因素解释了县级肥胖流行率的大部分变化。使用机器学习模型可能会显著更多地解释肥胖流行率的变化。

相似文献

1
Identification of Factors Associated With Variation in US County-Level Obesity Prevalence Rates Using Epidemiologic vs Machine Learning Models.使用流行病学模型与机器学习模型识别与美国县一级肥胖患病率变化相关的因素。
JAMA Netw Open. 2019 Apr 5;2(4):e192884. doi: 10.1001/jamanetworkopen.2019.2884.
2
Comparison of US County-Level Public Health Performance Rankings With County Cluster and National Rankings: Assessment Based on Prevalence Rates of Smoking and Obesity and Motor Vehicle Crash Death Rates.美国县一级公共卫生绩效排名与县聚类和全国排名的比较:基于吸烟和肥胖患病率以及机动车事故死亡率的评估。
JAMA Netw Open. 2019 Jan 4;2(1):e186816. doi: 10.1001/jamanetworkopen.2018.6816.
3
Regional Variation in the Association of Poverty and Heart Failure Mortality in the 3135 Counties of the United States.美国 3135 个县贫困与心力衰竭死亡率相关性的地域差异。
J Am Heart Assoc. 2019 Sep 17;8(18):e012422. doi: 10.1161/JAHA.119.012422. Epub 2019 Sep 4.
4
County-Level Variation in Cardiovascular Disease Mortality in the United States in 2009-2013: Comparative Assessment of Contributing Factors.2009 - 2013年美国县级心血管疾病死亡率的差异:影响因素的比较评估
Am J Epidemiol. 2016 Dec 15;184(12):933-942. doi: 10.1093/aje/kww081. Epub 2016 Nov 17.
5
Inequalities in Life Expectancy Among US Counties, 1980 to 2014: Temporal Trends and Key Drivers.1980年至2014年美国各县预期寿命的不平等:时间趋势和主要驱动因素
JAMA Intern Med. 2017 Jul 1;177(7):1003-1011. doi: 10.1001/jamainternmed.2017.0918.
6
Rural-Urban Disparities in Obesity Prevalence Among Working Age Adults in the United States: Exploring the Mechanisms.美国劳动年龄成年人肥胖患病率的城乡差异:探究其机制
Am J Health Promot. 2018 Feb;32(2):400-408. doi: 10.1177/0890117116689488. Epub 2017 Feb 1.
7
Factors Associated With County-Level Variation in Premature Mortality Due to Noncommunicable Chronic Disease in the United States, 1999-2017.美国 1999-2017 年非传染性慢性疾病导致的过早死亡率的县际差异相关因素。
JAMA Netw Open. 2020 Feb 5;3(2):e200241. doi: 10.1001/jamanetworkopen.2020.0241.
8
Evaluation of Between-County Disparities in Premature Mortality Due to Stroke in the US.评估美国因中风导致的过早死亡率的县际差异。
JAMA Netw Open. 2021 May 3;4(5):e214488. doi: 10.1001/jamanetworkopen.2021.4488.
9
The geographic distribution of obesity by census tract among 59 767 insured adults in King County, WA.华盛顿州金县59767名参保成年人中按普查区划分的肥胖地理分布情况。
Int J Obes (Lond). 2014 Jun;38(6):833-9. doi: 10.1038/ijo.2013.179. Epub 2013 Sep 16.
10
Factors Associated With Cancer Disparities Among Low-, Medium-, and High-Income US Counties.与美国低收入、中收入和高收入县癌症差异相关的因素。
JAMA Netw Open. 2018 Oct 5;1(6):e183146. doi: 10.1001/jamanetworkopen.2018.3146.

引用本文的文献

1
Interpretable Prediction of Myocardial Infarction Using Explainable Boosting Machines: A Biomarker-Based Machine Learning Approach.使用可解释增强机器对心肌梗死进行可解释预测:一种基于生物标志物的机器学习方法。
Diagnostics (Basel). 2025 Sep 1;15(17):2219. doi: 10.3390/diagnostics15172219.
2
Harnessing Artificial Intelligence in Obesity Research and Management: A Comprehensive Review.肥胖研究与管理中人工智能的应用:综述
Diagnostics (Basel). 2025 Feb 6;15(3):396. doi: 10.3390/diagnostics15030396.
3
Place effects on adult obesity and cardiometabolic health: Evidence from a natural experiment.

本文引用的文献

1
Use of Deep Learning to Examine the Association of the Built Environment With Prevalence of Neighborhood Adult Obesity.利用深度学习研究建筑环境与社区成年人肥胖患病率之间的关系。
JAMA Netw Open. 2018 Aug 3;1(4):e181535. doi: 10.1001/jamanetworkopen.2018.1535.
2
Differences in Obesity Prevalence by Demographic Characteristics and Urbanization Level Among Adults in the United States, 2013-2016.美国成年人中,按人口统计学特征和城市化水平划分的肥胖患病率差异,2013-2016 年。
JAMA. 2018 Jun 19;319(23):2419-2429. doi: 10.1001/jama.2018.7270.
3
Geographical variation in the prevalence of obesity, metabolic syndrome, and diabetes among US adults.
居住环境对成人肥胖及心血管代谢健康的影响:来自一项自然实验的证据。
Health Place. 2025 Mar;92:103427. doi: 10.1016/j.healthplace.2025.103427. Epub 2025 Feb 8.
4
Environmental factors affecting the BMI of older adults in the Philippines spatially assessed using machine learning.利用机器学习对影响菲律宾老年人身体质量指数的环境因素进行空间评估。
Heliyon. 2024 Dec 6;11(1):e40904. doi: 10.1016/j.heliyon.2024.e40904. eCollection 2025 Jan 15.
5
Computational algorithm based on health and lifestyle traits to categorize lifemetabotypes in the NUTRiMDEA cohort.基于健康和生活方式特征的计算算法,对 NUTRiMDEA 队列中的生命代谢体型进行分类。
Sci Rep. 2024 Oct 22;14(1):24835. doi: 10.1038/s41598-024-75110-z.
6
Reliable prediction of childhood obesity using only routinely collected EHRs may be possible.仅使用常规收集的电子健康记录(EHRs)来可靠预测儿童肥胖症或许是可行的。
Obes Pillars. 2024 Sep 10;12:100128. doi: 10.1016/j.obpill.2024.100128. eCollection 2024 Dec.
7
Combination of Machine Learning Techniques to Predict Overweight/Obesity in Adults.结合机器学习技术预测成年人超重/肥胖情况
J Pers Med. 2024 Jul 31;14(8):816. doi: 10.3390/jpm14080816.
8
County-level socio-environmental factors and obesity prevalence in the United States.美国县级社会环境因素与肥胖流行状况。
Diabetes Obes Metab. 2024 May;26(5):1766-1774. doi: 10.1111/dom.15488. Epub 2024 Feb 14.
9
An interpretable machine learning model of cross-sectional U.S. county-level obesity prevalence using explainable artificial intelligence.利用可解释人工智能对美国县级横断面肥胖流行率进行可解释的机器学习模型
PLoS One. 2023 Oct 5;18(10):e0292341. doi: 10.1371/journal.pone.0292341. eCollection 2023.
10
Identifying Young Adults at High Risk for Weight Gain Using Machine Learning.利用机器学习识别易增重的青年成年人。
J Surg Res. 2023 Nov;291:7-16. doi: 10.1016/j.jss.2023.05.015. Epub 2023 Jun 15.
美国成年人中肥胖、代谢综合征和糖尿病的流行率存在地域差异。
Nutr Diabetes. 2018 Mar 13;8(1):14. doi: 10.1038/s41387-018-0024-2.
4
A review of machine learning in obesity.机器学习在肥胖领域的研究综述。
Obes Rev. 2018 May;19(5):668-685. doi: 10.1111/obr.12667. Epub 2018 Feb 9.
5
Variations in Obesity Rates between US Counties: Impacts of Activity Access, Food Environments, and Settlement Patterns.美国各县肥胖率的差异:活动可达性、食物环境和居住模式的影响
Int J Environ Res Public Health. 2017 Sep 7;14(9):1023. doi: 10.3390/ijerph14091023.
6
Deaths Attributable to Diabetes in the United States: Comparison of Data Sources and Estimation Approaches.美国糖尿病所致死亡:数据来源与估算方法的比较
PLoS One. 2017 Jan 25;12(1):e0170219. doi: 10.1371/journal.pone.0170219. eCollection 2017.
7
Redrawing the US Obesity Landscape: Bias-Corrected Estimates of State-Specific Adult Obesity Prevalence.重塑美国肥胖现状:针对各州特定成人肥胖患病率的偏差校正估计值
PLoS One. 2016 Mar 8;11(3):e0150735. doi: 10.1371/journal.pone.0150735. eCollection 2016.
8
Change in Obesity Prevalence across the United States Is Influenced by Recreational and Healthcare Contexts, Food Environments, and Hispanic Populations.美国肥胖患病率的变化受娱乐与医疗环境、食物环境以及西班牙裔人口的影响。
PLoS One. 2016 Feb 5;11(2):e0148394. doi: 10.1371/journal.pone.0148394. eCollection 2016.
9
Decomposing Racial Disparities in Obesity Prevalence: Variations in Retail Food Environment.剖析肥胖患病率中的种族差异:零售食品环境的变化
Am J Prev Med. 2016 Mar;50(3):365-372. doi: 10.1016/j.amepre.2015.08.004. Epub 2015 Oct 23.
10
Machine Learning Techniques for Prediction of Early Childhood Obesity.用于预测儿童早期肥胖的机器学习技术
Appl Clin Inform. 2015 Aug 12;6(3):506-20. doi: 10.4338/ACI-2015-03-RA-0036. eCollection 2015.