Institute for Health Metrics and Evaluation, Seattle, Washington.
Department of Health Metrics Sciences, University of Washington, Seattle.
JAMA Pediatr. 2019 Jun 1;173(6):e190337. doi: 10.1001/jamapediatrics.2019.0337. Epub 2019 Jun 3.
Understanding causes and correlates of health loss among children and adolescents can identify areas of success, stagnation, and emerging threats and thereby facilitate effective improvement strategies.
To estimate mortality and morbidity in children and adolescents from 1990 to 2017 by age and sex in 195 countries and territories.
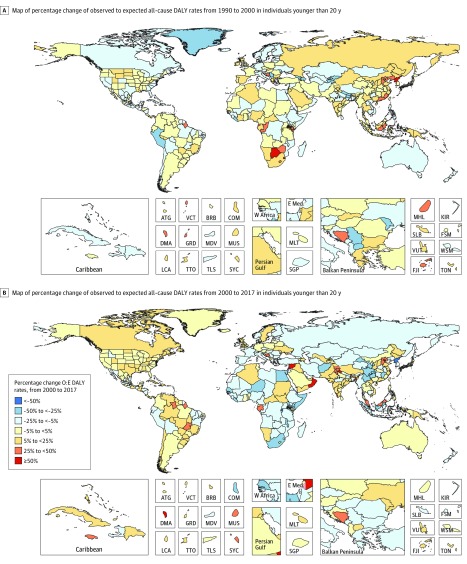
DESIGN, SETTING, AND PARTICIPANTS: This study examined levels, trends, and spatiotemporal patterns of cause-specific mortality and nonfatal health outcomes using standardized approaches to data processing and statistical analysis. It also describes epidemiologic transitions by evaluating historical associations between disease indicators and the Socio-Demographic Index (SDI), a composite indicator of income, educational attainment, and fertility. Data collected from 1990 to 2017 on children and adolescents from birth through 19 years of age in 195 countries and territories were assessed. Data analysis occurred from January 2018 to August 2018.
Being under the age of 20 years between 1990 and 2017.
Death and disability. All-cause and cause-specific deaths, disability-adjusted life years, years of life lost, and years of life lived with disability.
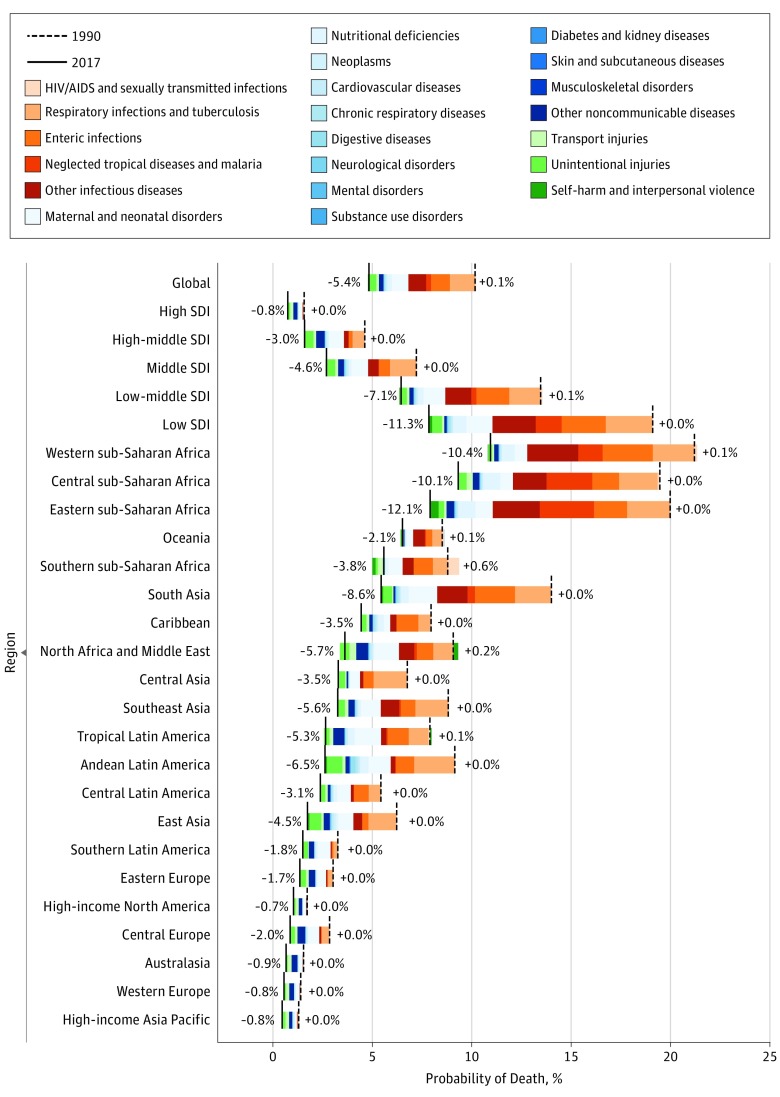
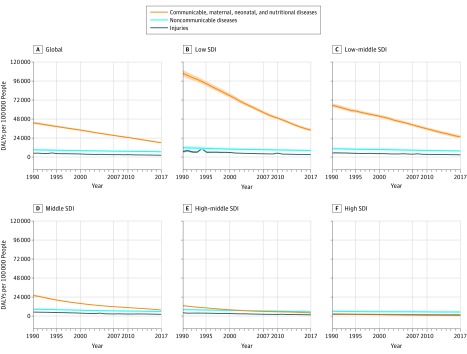
Child and adolescent deaths decreased 51.7% from 13.77 million (95% uncertainty interval [UI], 13.60-13.93 million) in 1990 to 6.64 million (95% UI, 6.44-6.87 million) in 2017, but in 2017, aggregate disability increased 4.7% to a total of 145 million (95% UI, 107-190 million) years lived with disability globally. Progress was uneven, and inequity increased, with low-SDI and low-middle-SDI locations experiencing 82.2% (95% UI, 81.6%-82.9%) of deaths, up from 70.9% (95% UI, 70.4%-71.4%) in 1990. The leading disaggregated causes of disability-adjusted life years in 2017 in the low-SDI quintile were neonatal disorders, lower respiratory infections, diarrhea, malaria, and congenital birth defects, whereas neonatal disorders, congenital birth defects, headache, dermatitis, and anxiety were highest-ranked in the high-SDI quintile.
Mortality reductions over this 27-year period mean that children are more likely than ever to reach their 20th birthdays. The concomitant expansion of nonfatal health loss and epidemiological transition in children and adolescents, especially in low-SDI and middle-SDI countries, has the potential to increase already overburdened health systems, will affect the human capital potential of societies, and may influence the trajectory of socioeconomic development. Continued monitoring of child and adolescent health loss is crucial to sustain the progress of the past 27 years.
了解儿童和青少年健康损失的原因和相关性,可以确定成功、停滞和新出现的威胁领域,从而促进有效的改善策略。
按年龄和性别估计 195 个国家和地区 1990 年至 2017 年儿童和青少年的死亡率和发病率。
设计、设置和参与者:本研究使用标准化的数据处理和统计分析方法,检查特定原因死亡率和非致命健康结果的水平、趋势和时空模式。通过评估疾病指标与社会发展指数(SDI)之间的历史关联,还描述了流行病学转变,SDI 是收入、教育程度和生育率的综合指标。评估了 195 个国家和地区 1990 年至 2017 年出生至 19 岁儿童和青少年的数据。数据分析于 2018 年 1 月至 8 月进行。
1990 年至 2017 年间年龄在 20 岁以下。
死亡和残疾。全因和特定原因死亡、伤残调整生命年、生命损失年和生命残疾年。
儿童和青少年死亡人数从 1990 年的 1377 万人(95%不确定区间[UI],13.60-13.93 万人)下降了 51.7%,至 2017 年的 664 万人(95% UI,6.44-6.87 万人),但 2017 年,全球残疾总人数增加了 4.7%,达到 1.45 亿(95% UI,1.07-1.90 亿)年残疾生命。进展不平衡,不平等加剧,低社会发展指数和中低社会发展指数地区的死亡人数占 82.2%(95% UI,81.6%-82.9%),高于 1990 年的 70.9%(95% UI,70.4%-71.4%)。2017 年低社会发展指数五分位数中伤残调整生命年的主要致残原因是新生儿疾病、下呼吸道感染、腹泻、疟疾和先天性出生缺陷,而新生儿疾病、先天性出生缺陷、头痛、皮炎和焦虑是高社会发展指数五分位数中排名最高的。
在这 27 年期间,死亡率的降低意味着儿童比以往任何时候都更有可能活到 20 岁生日。儿童和青少年非致命性健康损失和流行病学转变的同时扩大,特别是在低社会发展指数和中等社会发展指数国家,有可能增加已经负担过重的卫生系统,影响社会的人力资本潜力,并可能影响社会经济发展的轨迹。继续监测儿童和青少年的健康损失对于维持过去 27 年的进展至关重要。