Gerlach J C, Demos G, Sornette D
Department of Management, Technology and Economics ETH Zürich, Zürich, Switzerland.
Swiss Finance Institute, c/o University of Geneva, Geneva, Switzerland.
R Soc Open Sci. 2019 Jul 24;6(7):180643. doi: 10.1098/rsos.180643. eCollection 2019 Jul.
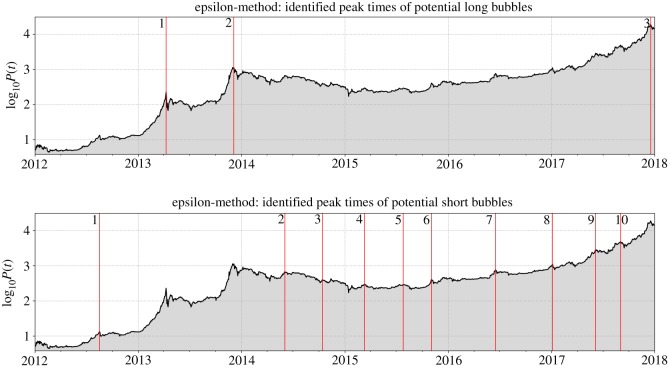
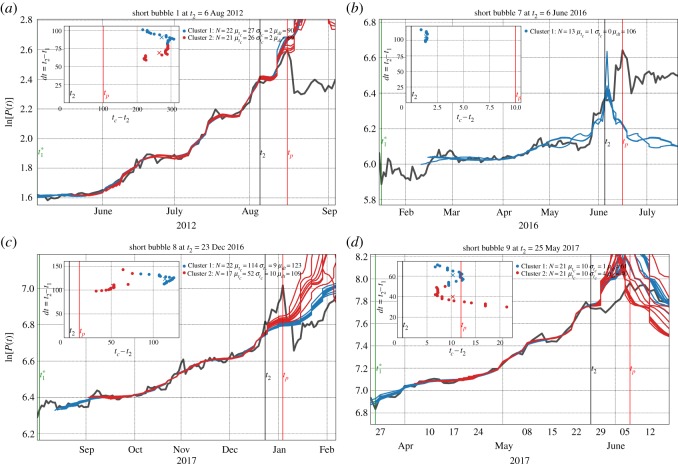
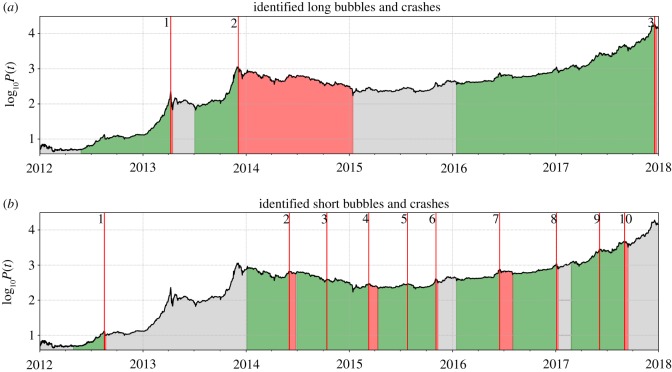
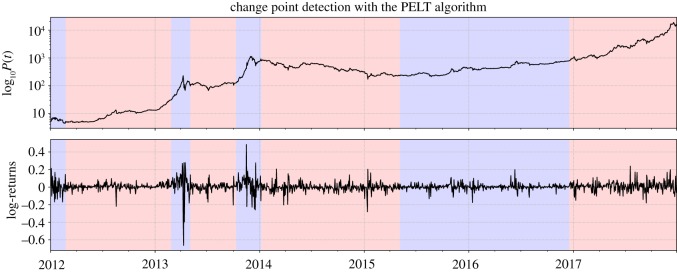
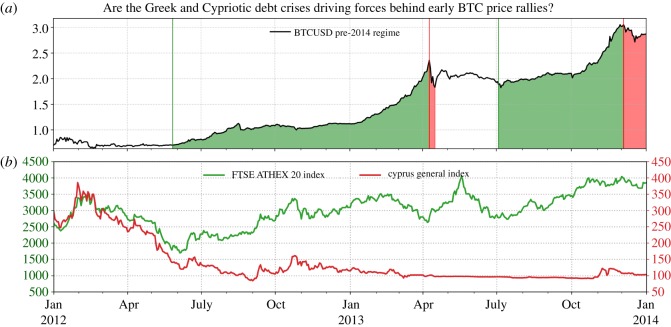
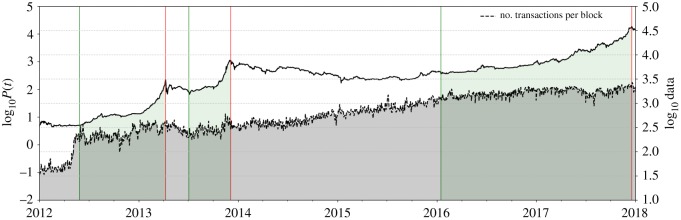
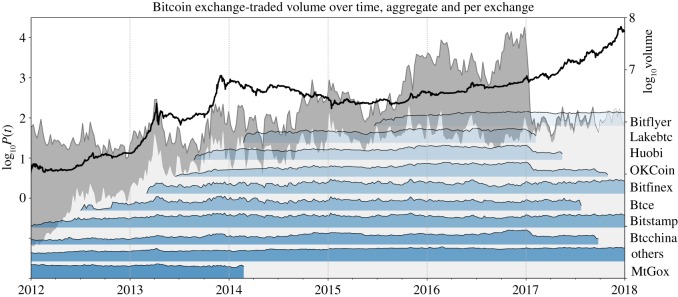
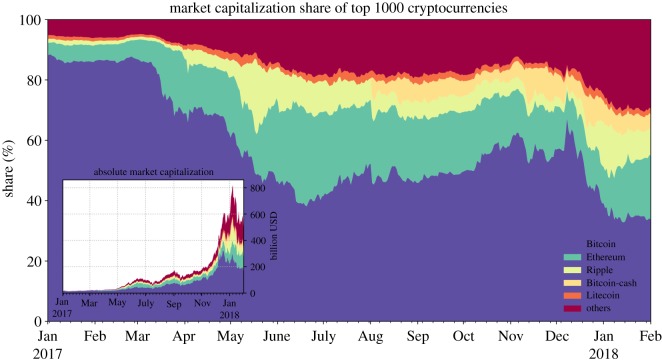
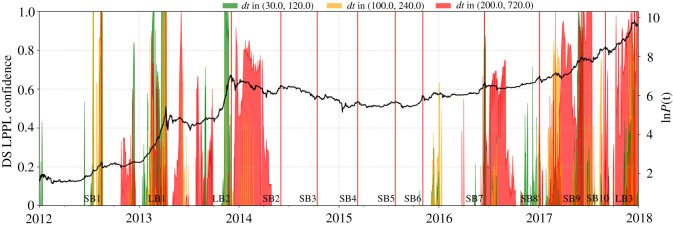
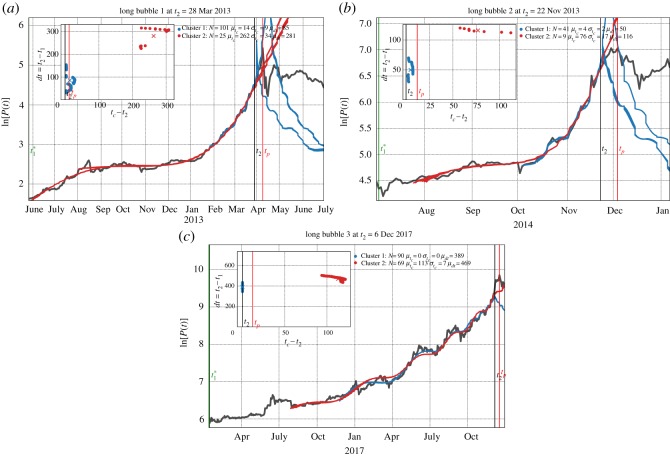
We present a detailed bubble analysis of the Bitcoin to US Dollar price dynamics from January 2012 to February 2018. We introduce a robust automatic peak detection method that classifies price time series into periods of uninterrupted market growth (drawups) and regimes of uninterrupted market decrease (drawdowns). In combination with the for detecting the beginning of a new market regime, we identify three major peaks and 10 additional smaller peaks, that have punctuated the dynamics of Bitcoin price during the analysed time period. We explain this classification of long and short bubbles by a number of quantitative metrics and graphs to understand the main socio-economic drivers behind the ascent of Bitcoin over this period. Then, a detailed analysis of the growing risks associated with the three long bubbles using the (LPPLS) model is based on the , defined as the fraction of qualified fits of the LPPLS model over multiple time windows. Furthermore, for various fictitious 'present' times before the crashes, we employ a clustering method to group the predicted critical times of the LPPLS fits over different time scales, where is the most probable time for the ending of the bubble. Each cluster is proposed as a plausible scenario for the subsequent Bitcoin price evolution. We present these predictions for the three long bubbles and the four short bubbles that our time scale of analysis was able to resolve. Overall, our predictive scheme provides useful information to warn of an imminent crash risk.
我们展示了2012年1月至2018年2月比特币兑美元价格动态的详细泡沫分析。我们引入了一种强大的自动峰值检测方法,该方法将价格时间序列分为市场持续增长期(上涨)和市场持续下跌期(下跌)。结合用于检测新市场阶段开始的方法,我们识别出三个主要峰值和另外10个较小的峰值,这些峰值在分析时间段内贯穿了比特币价格动态。我们通过一些定量指标和图表解释了长短期泡沫的这种分类,以了解这一时期比特币上涨背后的主要社会经济驱动因素。然后,基于LPPLS(对数周期幂律奇点)模型,使用拟合优度(定义为LPPLS模型在多个时间窗口上的合格拟合比例)对与三个长泡沫相关的不断增加的风险进行详细分析。此外,对于崩溃前的各种虚拟“当前”时间,我们采用聚类方法将LPPLS拟合在不同时间尺度上的预测关键时间进行分组,其中 是泡沫结束的最可能时间。每个聚类都被提出作为比特币价格后续演变的一个合理情景。我们给出了对我们分析时间尺度能够解析的三个长泡沫和四个短泡沫的这些预测。总体而言,我们的预测方案提供了有用信息,以警告即将到来的崩溃风险。