• 文献检索
  • 文档翻译
  • 深度研究
  • 学术资讯
  • Suppr Zotero 插件Zotero 插件
  • 邀请有礼
  • 套餐&价格
  • 历史记录
应用&插件
Suppr Zotero 插件Zotero 插件浏览器插件Mac 客户端Windows 客户端微信小程序
定价
高级版会员购买积分包购买API积分包
服务
文献检索文档翻译深度研究API 文档MCP 服务
关于我们
关于 Suppr公司介绍联系我们用户协议隐私条款
关注我们

Suppr 超能文献

核心技术专利:CN118964589B侵权必究
粤ICP备2023148730 号-1Suppr @ 2026

文献检索

告别复杂PubMed语法,用中文像聊天一样搜索,搜遍4000万医学文献。AI智能推荐,让科研检索更轻松。

立即免费搜索

文件翻译

保留排版,准确专业,支持PDF/Word/PPT等文件格式,支持 12+语言互译。

免费翻译文档

深度研究

AI帮你快速写综述,25分钟生成高质量综述,智能提取关键信息,辅助科研写作。

立即免费体验

利用公开数据对全球电力系统进行预测性建模。

Predictive mapping of the global power system using open data.

机构信息

World Bank Group, Washington, D.C., USA.

Environmental Change Institute, University of Oxford, Oxford, UK.

出版信息

Sci Data. 2020 Jan 15;7(1):19. doi: 10.1038/s41597-019-0347-4.

DOI:10.1038/s41597-019-0347-4
PMID:31941897
原文链接:https://pmc.ncbi.nlm.nih.gov/articles/PMC6962213/
Abstract

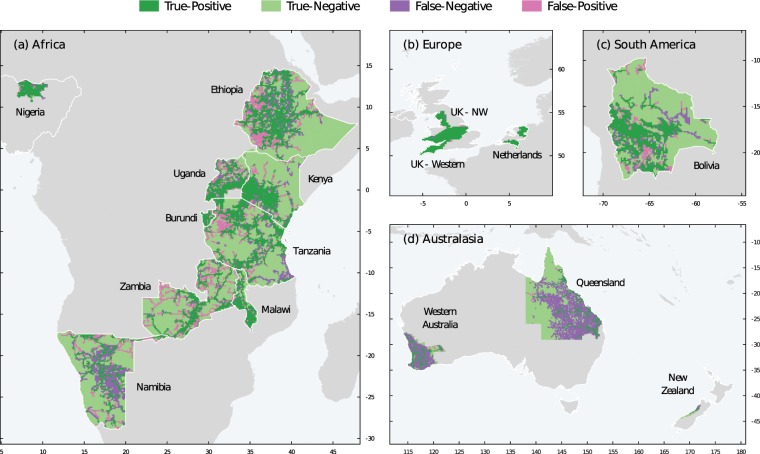
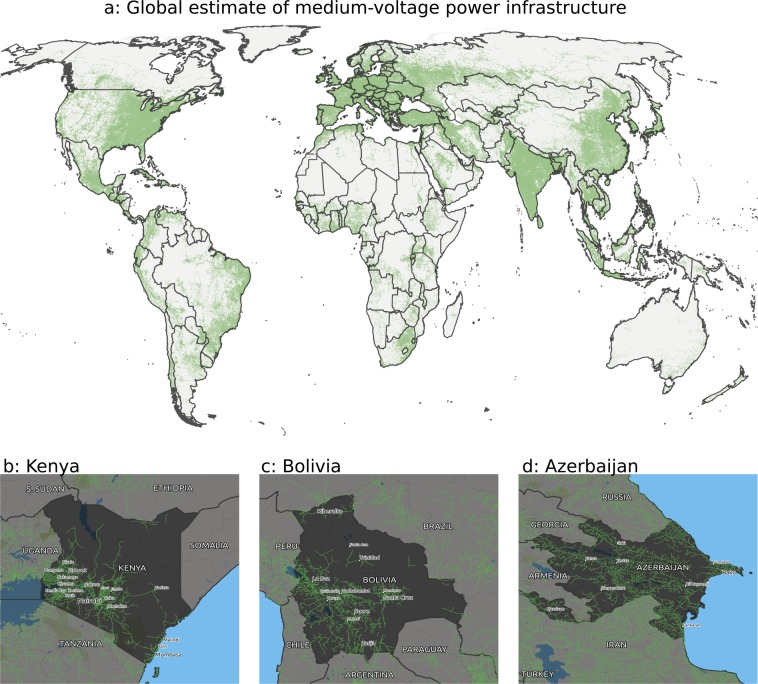
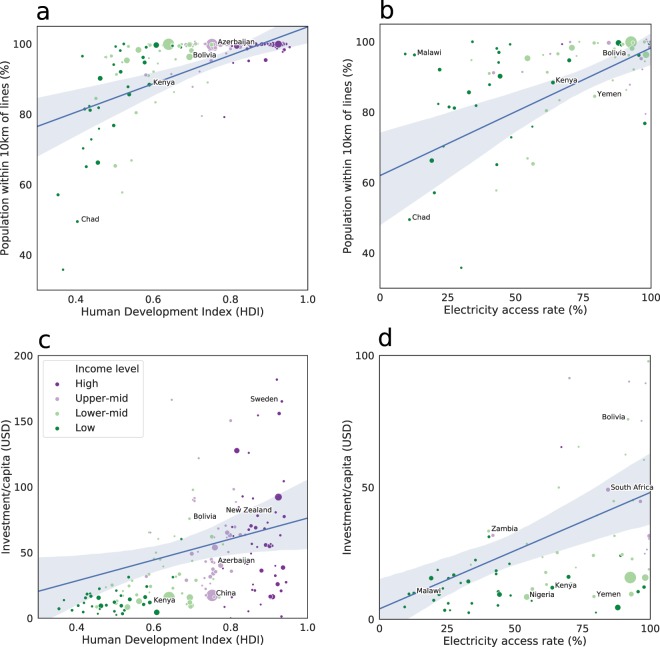
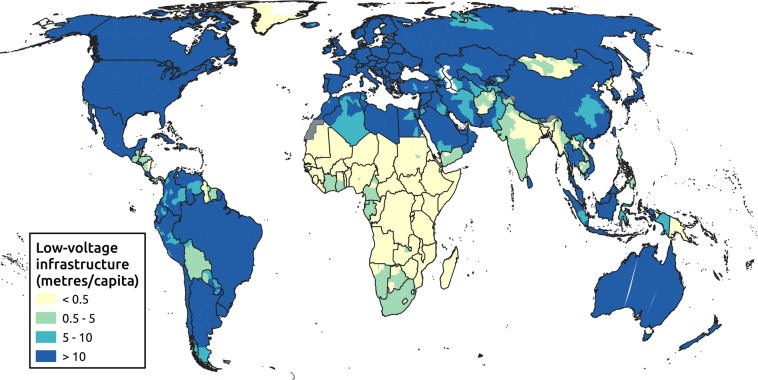
Limited data on global power infrastructure makes it difficult to respond to challenges in electricity access and climate change. Although high-voltage data on transmission networks are often available, medium- and low-voltage data are often non-existent or unavailable. This presents a challenge for practitioners working on the electricity access agenda, power sector resilience or climate change adaptation. Using state-of-the-art algorithms in geospatial data analysis, we create a first composite map of the global power system with an open license. We find that 97% of the global population lives within 10 km of a MV line, but with large variations between regions and income levels. We show an accuracy of 75% across our validation set of 14 countries, and we demonstrate the value of these data at both a national and regional level. The results from this study pave the way for improved efforts in electricity modelling and planning and are an important step in tackling the Sustainable Development Goals.

摘要

有关全球电力基础设施的资料有限,这使得应对电力供应和气候变化方面的挑战变得困难。尽管传输网络的高压数据通常是可用的,但中压和低压数据通常不存在或无法获得。这给从事电力供应议程、电力部门弹性或适应气候变化工作的从业人员带来了挑战。我们使用地理空间数据分析的最先进算法,创建了一个带有开放许可证的全球电力系统复合图。我们发现,全球 97%的人口居住在距离中压线路 10 公里以内的地方,但地区和收入水平之间存在很大差异。在我们的 14 个国家验证集中,我们的准确率达到了 75%,并展示了这些数据在国家和地区层面的价值。本研究的结果为改进电力建模和规划工作铺平了道路,是实现可持续发展目标的重要一步。

https://cdn.ncbi.nlm.nih.gov/pmc/blobs/0d99/6962213/298eb26204f4/41597_2019_347_Fig6_HTML.jpg
https://cdn.ncbi.nlm.nih.gov/pmc/blobs/0d99/6962213/7ac333bafdcd/41597_2019_347_Fig1_HTML.jpg
https://cdn.ncbi.nlm.nih.gov/pmc/blobs/0d99/6962213/71a182728499/41597_2019_347_Fig2_HTML.jpg
https://cdn.ncbi.nlm.nih.gov/pmc/blobs/0d99/6962213/2edd050993dc/41597_2019_347_Fig3_HTML.jpg
https://cdn.ncbi.nlm.nih.gov/pmc/blobs/0d99/6962213/af3653861ade/41597_2019_347_Fig4_HTML.jpg
https://cdn.ncbi.nlm.nih.gov/pmc/blobs/0d99/6962213/6b7dc33e96a0/41597_2019_347_Fig5_HTML.jpg
https://cdn.ncbi.nlm.nih.gov/pmc/blobs/0d99/6962213/298eb26204f4/41597_2019_347_Fig6_HTML.jpg

相似文献

1
Predictive mapping of the global power system using open data.利用公开数据对全球电力系统进行预测性建模。
Sci Data. 2020 Jan 15;7(1):19. doi: 10.1038/s41597-019-0347-4.
2
Folic acid supplementation and malaria susceptibility and severity among people taking antifolate antimalarial drugs in endemic areas.在流行地区,服用抗叶酸抗疟药物的人群中,叶酸补充剂与疟疾易感性和严重程度的关系。
Cochrane Database Syst Rev. 2022 Feb 1;2(2022):CD014217. doi: 10.1002/14651858.CD014217.
3
Resilience of the Eastern African electricity sector to climate driven changes in hydropower generation.东非电力部门对水力发电受气候驱动变化的弹性。
Nat Commun. 2019 Jan 17;10(1):302. doi: 10.1038/s41467-018-08275-7.
4
Climate-Water Adaptation for Future US Electricity Infrastructure.未来美国电力基础设施的气候-水适应性
Environ Sci Technol. 2019 Dec 3;53(23):14029-14040. doi: 10.1021/acs.est.9b03037. Epub 2019 Nov 20.
5
Viability of power distribution in India - Challenges and Way Forward.印度配电的可行性——挑战与未来之路
Energy Policy. 2020 Dec;147:111882. doi: 10.1016/j.enpol.2020.111882. Epub 2020 Oct 21.
6
Tuberculosis结核病
7
Global transcontinental power pools for low-carbon electricity.全球跨洲低碳电力联营体
Nat Commun. 2023 Dec 15;14(1):8350. doi: 10.1038/s41467-023-43723-z.
8
Winners and losers of energy sustainability-Global assessment of the Sustainable Development Goals.能源可持续性的赢家和输家——可持续发展目标的全球评估。
Sci Total Environ. 2022 Jul 20;831:154945. doi: 10.1016/j.scitotenv.2022.154945. Epub 2022 Apr 1.
9
The Minderoo-Monaco Commission on Plastics and Human Health.美诺集团-摩纳哥基金会塑料与人体健康委员会
Ann Glob Health. 2023 Mar 21;89(1):23. doi: 10.5334/aogh.4056. eCollection 2023.
10
A global inventory of electricity infrastructures from 1980 to 2017: Country-level data on power plants, grids and transformers.1980年至2017年全球电力基础设施清单:关于发电厂、电网和变压器的国家级数据。
Data Brief. 2021 Sep 9;38:107351. doi: 10.1016/j.dib.2021.107351. eCollection 2021 Oct.

引用本文的文献

1
Globally interconnected solar-wind system addresses future electricity demands.全球互联的太阳风系统可满足未来的电力需求。
Nat Commun. 2025 May 15;16(1):4523. doi: 10.1038/s41467-025-59879-9.
2
Mapping 10-m Industrial Lands across 1000+ Global Large Cities, 2017-2023.绘制2017 - 2023年全球1000多个大城市的10米工业用地地图。
Sci Data. 2025 Feb 16;12(1):278. doi: 10.1038/s41597-025-04604-w.
3
Efficient Vertical Structure Correlation and Power Line Inference.高效垂直结构相关性与电力线推断

本文引用的文献

1
A high-resolution gridded dataset to assess electrification in sub-Saharan Africa.高分辨率网格化数据集评估撒哈拉以南非洲地区的电气化水平。
Sci Data. 2019 Jul 3;6(1):110. doi: 10.1038/s41597-019-0122-6.
2
A global multi-hazard risk analysis of road and railway infrastructure assets.道路和铁路基础设施资产的全球多灾种风险分析。
Nat Commun. 2019 Jun 25;10(1):2677. doi: 10.1038/s41467-019-10442-3.
3
A global map of travel time to cities to assess inequalities in accessibility in 2015.全球城市出行时间图评估 2015 年可达性的不平等。
Sensors (Basel). 2024 Mar 5;24(5):1686. doi: 10.3390/s24051686.
4
Machine learning-based spatial data development for optimizing astronomical observatory sites in Indonesia.基于机器学习的空间数据开发,用于优化印度尼西亚的天文观测站选址。
PLoS One. 2023 Oct 20;18(10):e0293190. doi: 10.1371/journal.pone.0293190. eCollection 2023.
5
Geospatial mapping of distribution grid with machine learning and publicly-accessible multi-modal data.利用机器学习和公开可用的多模态数据对配电网进行地理空间映射。
Nat Commun. 2023 Aug 17;14(1):5006. doi: 10.1038/s41467-023-39647-3.
6
A GIS-based interactive map enabling data-driven decision-making in Nigeria's food supply chain.一个基于地理信息系统的交互式地图,助力尼日利亚食品供应链中的数据驱动型决策。
MethodsX. 2023 Feb 1;10:102047. doi: 10.1016/j.mex.2023.102047. eCollection 2023.
7
Fragmentation of outage clusters during the recovery of power distribution grids.配电网恢复过程中停电集群的碎片化
Nat Commun. 2022 Nov 30;13(1):7372. doi: 10.1038/s41467-022-35104-9.
8
An all-Africa dataset of energy model "supply regions" for solar photovoltaic and wind power.一个涵盖全非洲的太阳能光伏和风能能源模型“供应区域”数据集。
Sci Data. 2022 Oct 31;9(1):664. doi: 10.1038/s41597-022-01786-5.
9
Achieving universal electrification of rural healthcare facilities in sub-Saharan Africa with decentralized renewable energy technologies.利用分散式可再生能源技术实现撒哈拉以南非洲农村医疗设施的全面电气化。
Joule. 2021 Oct 20;5(10):2687-2714. doi: 10.1016/j.joule.2021.09.010.
10
Population cluster data to assess the urban-rural split and electrification in Sub-Saharan Africa.人群聚居数据评估撒哈拉以南非洲的城乡划分和通电情况。
Sci Data. 2021 Apr 23;8(1):117. doi: 10.1038/s41597-021-00897-9.
Nature. 2018 Jan 18;553(7688):333-336. doi: 10.1038/nature25181. Epub 2018 Jan 10.
4
Limited electricity access in health facilities of sub-Saharan Africa: a systematic review of data on electricity access, sources, and reliability.撒哈拉以南非洲卫生机构电力供应有限:电力供应、来源和可靠性数据的系统评价。
Glob Health Sci Pract. 2013 Aug 14;1(2):249-61. doi: 10.9745/GHSP-D-13-00037. eCollection 2013 Aug.