• 文献检索
  • 文档翻译
  • 深度研究
  • 学术资讯
  • Suppr Zotero 插件Zotero 插件
  • 邀请有礼
  • 套餐&价格
  • 历史记录
应用&插件
Suppr Zotero 插件Zotero 插件浏览器插件Mac 客户端Windows 客户端微信小程序
定价
高级版会员购买积分包购买API积分包
服务
文献检索文档翻译深度研究API 文档MCP 服务
关于我们
关于 Suppr公司介绍联系我们用户协议隐私条款
关注我们

Suppr 超能文献

核心技术专利:CN118964589B侵权必究
粤ICP备2023148730 号-1Suppr @ 2026

文献检索

告别复杂PubMed语法,用中文像聊天一样搜索,搜遍4000万医学文献。AI智能推荐,让科研检索更轻松。

立即免费搜索

文件翻译

保留排版,准确专业,支持PDF/Word/PPT等文件格式,支持 12+语言互译。

免费翻译文档

深度研究

AI帮你快速写综述,25分钟生成高质量综述,智能提取关键信息,辅助科研写作。

立即免费体验

中国全球天然气供应的碳足迹。

Carbon footprint of global natural gas supplies to China.

机构信息

Systems Assessment Center, Energy Systems Division, Argonne National Laboratory, Lemont, IL, USA.

Climate and Sustainability Group, Aramco Research Center-Detroit, Aramco Services Company, Novi, MI, USA.

出版信息

Nat Commun. 2020 Feb 11;11(1):824. doi: 10.1038/s41467-020-14606-4.

DOI:10.1038/s41467-020-14606-4
PMID:32047159
原文链接:https://pmc.ncbi.nlm.nih.gov/articles/PMC7012848/
Abstract

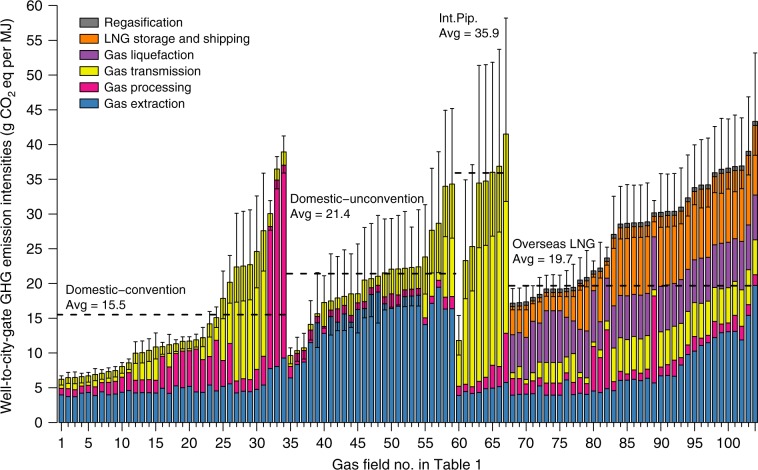
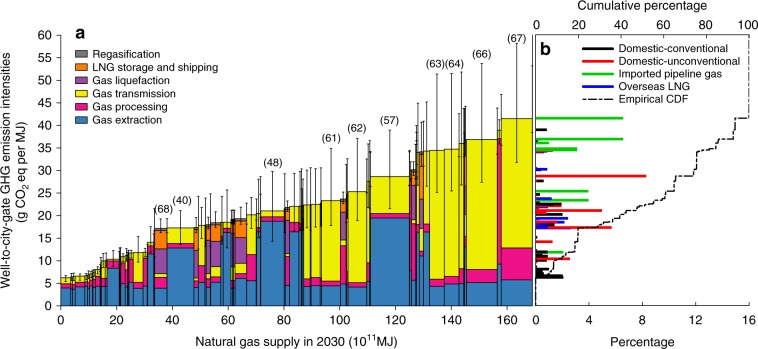
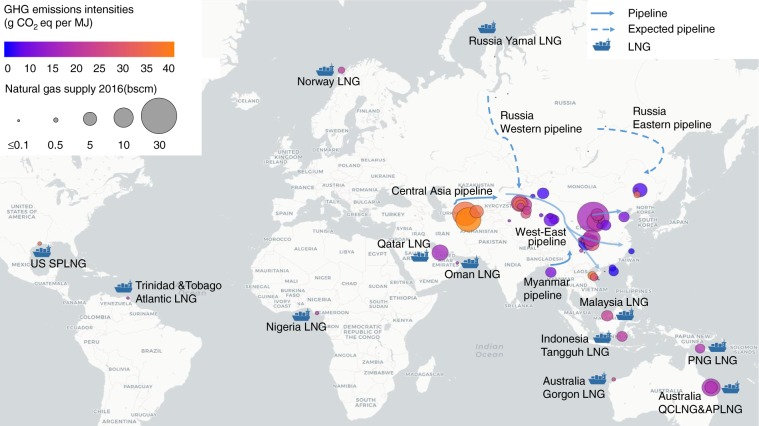
As natural gas demand surges in China, driven by the coal-to-gas switching policy, widespread attention is focused on its impacts on global gas supply-demand rebalance and greenhouse gas (GHG) emissions. Here, for the first time, we estimate well-to-city-gate GHG emissions of gas supplies for China, based on analyses of field-specific characteristics of 104 fields in 15 countries. Results show GHG intensities of supplies from 104 fields vary from 6.2 to 43.3 g COeq MJ. Due to the increase of GHG-intensive gas supplies from Russia, Central Asia, and domestic shale gas fields, the supply-energy-weighted average GHG intensity is projected to increase from 21.7 in 2016 to 23.3 COeq MJ in 2030, and total well-to-city-gate emissions of gas supplies are estimated to grow by ~3 times. While securing gas supply is a top priority for the Chinese government, decreasing GHG intensity should be considered in meeting its commitment to emission reductions.

摘要

随着中国“煤改气”政策推动天然气需求飙升,人们普遍关注其对全球天然气供需再平衡和温室气体(GHG)排放的影响。在此,我们首次根据 15 个国家的 104 个气田的具体特征分析,估算了中国天然气供应的井口到城市门站的温室气体排放。结果表明,104 个气田的供应温室气体强度从 6.2 到 43.3g COeq MJ 不等。由于俄罗斯、中亚和国内页岩气田的高温室气体强度天然气供应增加,预计供应能源加权平均温室气体强度将从 2016 年的 21.7 增加到 2030 年的 23.3 COeq MJ,天然气供应的总井口到城市门站的排放量预计将增长约 3 倍。在确保天然气供应是中国政府的首要任务的同时,在履行减排承诺方面,应考虑降低温室气体强度。

https://cdn.ncbi.nlm.nih.gov/pmc/blobs/b8b0/7012848/86c827657099/41467_2020_14606_Fig4_HTML.jpg
https://cdn.ncbi.nlm.nih.gov/pmc/blobs/b8b0/7012848/11bafa3149b8/41467_2020_14606_Fig1_HTML.jpg
https://cdn.ncbi.nlm.nih.gov/pmc/blobs/b8b0/7012848/d0a4fc27da52/41467_2020_14606_Fig3_HTML.jpg
https://cdn.ncbi.nlm.nih.gov/pmc/blobs/b8b0/7012848/86c827657099/41467_2020_14606_Fig4_HTML.jpg
https://cdn.ncbi.nlm.nih.gov/pmc/blobs/b8b0/7012848/11bafa3149b8/41467_2020_14606_Fig1_HTML.jpg
https://cdn.ncbi.nlm.nih.gov/pmc/blobs/b8b0/7012848/d0a4fc27da52/41467_2020_14606_Fig3_HTML.jpg
https://cdn.ncbi.nlm.nih.gov/pmc/blobs/b8b0/7012848/86c827657099/41467_2020_14606_Fig4_HTML.jpg

相似文献

1
Carbon footprint of global natural gas supplies to China.中国全球天然气供应的碳足迹。
Nat Commun. 2020 Feb 11;11(1):824. doi: 10.1038/s41467-020-14606-4.
2
Can Switching from Coal to Shale Gas Bring Net Carbon Reductions to China?从煤炭转向页岩气能否使中国实现净碳减排?
Environ Sci Technol. 2017 Mar 7;51(5):2554-2562. doi: 10.1021/acs.est.6b04072. Epub 2017 Feb 21.
3
Uncertainty in life cycle greenhouse gas emissions from United States natural gas end-uses and its effects on policy.美国天然气终端用途生命周期温室气体排放的不确定性及其对政策的影响。
Environ Sci Technol. 2011 Oct 1;45(19):8182-9. doi: 10.1021/es200930h. Epub 2011 Aug 30.
4
The Role of Industrial Parks in Mitigating Greenhouse Gas Emissions from China.工业园区在中国温室气体减排中的作用。
Environ Sci Technol. 2018 Jul 17;52(14):7754-7762. doi: 10.1021/acs.est.8b00537. Epub 2018 Jul 2.
5
Life cycle greenhouse gas emissions and freshwater consumption of Marcellus shale gas.马塞勒斯页岩气的生命周期温室气体排放和淡水消耗。
Environ Sci Technol. 2013 May 7;47(9):4896-903. doi: 10.1021/es305162w. Epub 2013 Apr 16.
6
The carbon footprint of the Chinese health-care system: an environmentally extended input-output and structural path analysis study.中国医疗体系的碳足迹:基于环境扩展投入产出和结构路径分析的研究
Lancet Planet Health. 2019 Oct;3(10):e413-e419. doi: 10.1016/S2542-5196(19)30192-5.
7
Unconventional Heavy Oil Growth and Global Greenhouse Gas Emissions.非常规重油增长与全球温室气体排放。
Environ Sci Technol. 2015 Jul 21;49(14):8824-32. doi: 10.1021/acs.est.5b01913. Epub 2015 Jul 8.
8
Variation Trend and Driving Factors of Greenhouse Gas Emissions from Chinese Magnesium Production.中国镁生产温室气体排放的变化趋势及驱动因素。
Environ Sci Technol. 2015 Nov 3;49(21):12662-9. doi: 10.1021/acs.est.5b01860. Epub 2015 Oct 16.
9
Life Cycle Greenhouse Gas Impacts of Coal and Imported Gas-Based Power Generation in the Indian Context.印度语境下煤电和进口天然气发电的生命周期温室气体影响。
Environ Sci Technol. 2019 Jan 2;53(1):539-549. doi: 10.1021/acs.est.8b04539. Epub 2018 Dec 11.
10
Greenhouse gas emissions and carbon footprint of collard greens, spinach and chicory production systems in Southeast of Brazil.巴西东南部羽衣甘蓝、菠菜和菊苣生产系统的温室气体排放及碳足迹
Front Plant Sci. 2022 Nov 2;13:1015307. doi: 10.3389/fpls.2022.1015307. eCollection 2022.

引用本文的文献

1
Challenges to sustainable large-scale shale gas development in China.中国大规模可持续页岩气开发面临的挑战。
Proc Natl Acad Sci U S A. 2025 May 6;122(18):e2415192122. doi: 10.1073/pnas.2415192122. Epub 2025 Apr 28.
2
Structural shifts in China's oil and gas CH emissions with implications for mitigation efforts.中国油气甲烷排放的结构变化及其对减排努力的影响。
Nat Commun. 2025 Mar 25;16(1):2926. doi: 10.1038/s41467-025-58237-z.
3
Maximizing the environmental benefits of gas power development in China: A multidisciplinary modeling approach.

本文引用的文献

1
Assessment of methane emissions from the U.S. oil and gas supply chain.评估美国油气供应链中的甲烷排放。
Science. 2018 Jul 13;361(6398):186-188. doi: 10.1126/science.aar7204. Epub 2018 Jun 21.
最大化中国天然气发电发展的环境效益:一种多学科建模方法。
iScience. 2024 Sep 30;27(11):111041. doi: 10.1016/j.isci.2024.111041. eCollection 2024 Nov 15.
4
Greenhouse gas emissions from U.S. crude oil pipeline accidents: 1968 to 2020.美国原油管道事故的温室气体排放量:1968 年至 2020 年。
Sci Data. 2023 Aug 24;10(1):563. doi: 10.1038/s41597-023-02478-4.
5
Ecological Responses of Soil Microbial Communities to Heavy Metal Stress in a Coal-Based Industrial Region in China.中国某煤炭工业地区土壤微生物群落对重金属胁迫的生态响应
Microorganisms. 2023 May 25;11(6):1392. doi: 10.3390/microorganisms11061392.
6
Manipulating local coordination of copper single atom catalyst enables efficient CO-to-CH conversion.调控铜单原子催化剂的局域配位实现高效 CO 到 CH 的转化。
Nat Commun. 2023 Jun 8;14(1):3382. doi: 10.1038/s41467-023-39048-6.
7
An inventory of greenhouse gas emissions due to natural gas pipeline incidents in the United States and Canada from 1980s to 2021.美国和加拿大 1980 年代至 2021 年天然气管道事故导致的温室气体排放清单。
Sci Data. 2023 May 13;10(1):282. doi: 10.1038/s41597-023-02177-0.
8
Excess methane emissions from shallow water platforms elevate the carbon intensity of US Gulf of Mexico oil and gas production.浅水平台产生的过量甲烷排放增加了美国墨西哥湾石油和天然气生产的碳强度。
Proc Natl Acad Sci U S A. 2023 Apr 11;120(15):e2215275120. doi: 10.1073/pnas.2215275120. Epub 2023 Apr 3.
9
The climate impact of high seas shipping.公海航运对气候的影响。
Natl Sci Rev. 2022 Dec 8;10(3):nwac279. doi: 10.1093/nsr/nwac279. eCollection 2023 Mar.
10
Minimising carbon and financial costs of steam sterilisation and packaging of reusable surgical instruments.尽量降低可重复使用手术器械的蒸汽灭菌和包装的碳足迹和财务成本。
Br J Surg. 2022 Feb 1;109(2):200-210. doi: 10.1093/bjs/znab406.