Institute for Health Transformation, Global Obesity Centre, Deakin University, Geelong 3220, Australia.
Faculty of Health, Biostatistics Unit, Deakin University, Geelong 3220, Australia.
Int J Environ Res Public Health. 2020 Feb 19;17(4):1321. doi: 10.3390/ijerph17041321.
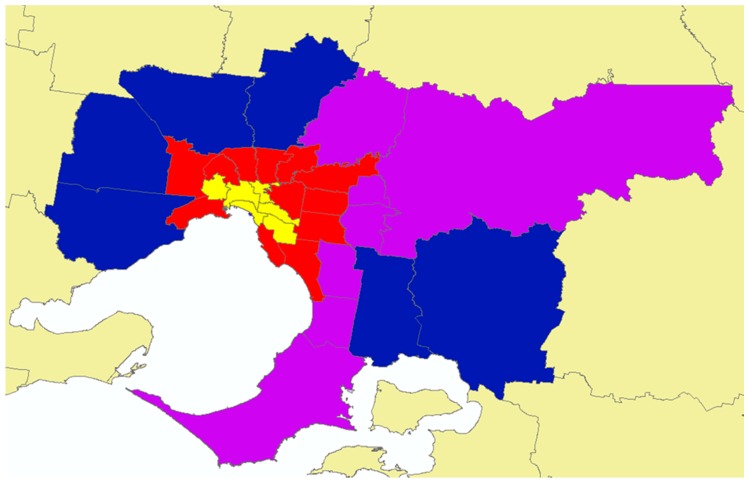
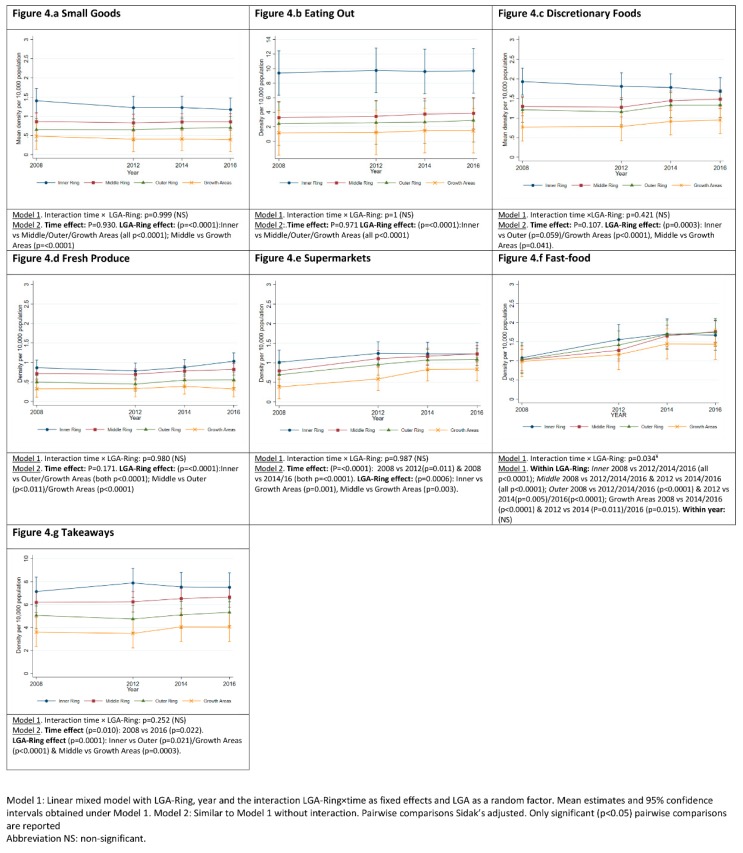
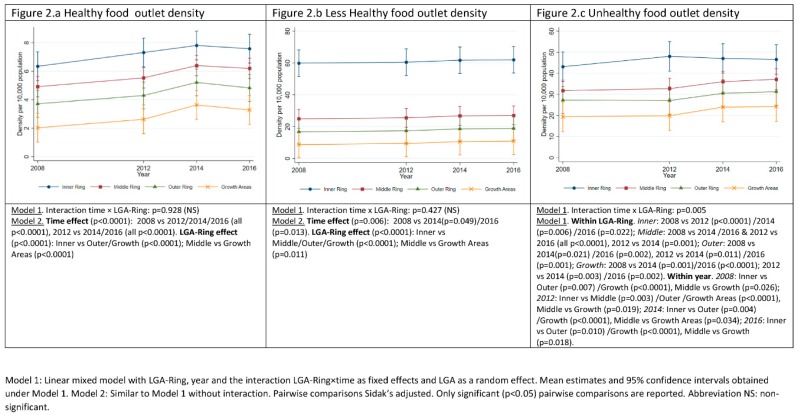
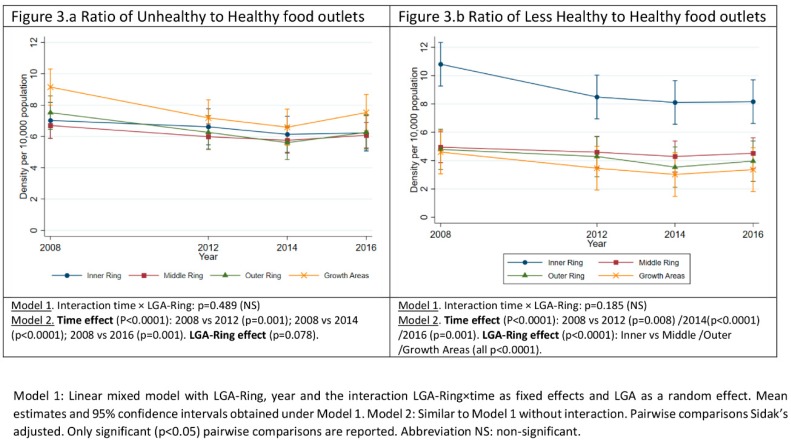
Obesity prevalence is inequitably distributed across geographic areas. Food environments may contribute to health disparities, yet little is known about how food environments are evolving over time and how this may influence dietary intake and weight. This study aimed to analyse intra-city variation in density and healthiness of food outlets between 2008 and 2016 in Melbourne, Australia. Food outlet data were classified by location, type and healthiness. Local government areas (LGAs) were classified into four groups representing distance from the central business district. Residential population estimates for each LGA were used to calculate the density of food outlets per 10,000 residents. Linear mixed models were fitted to estimate the mean density and ratio of 'healthy' to 'unhealthy' food outlets and food outlet 'types' by LGA group over time. The number of food outlets increased at a faster rate than the residential population, driven by an increasing density of both 'unhealthy' and 'healthy' outlets. Across all years, ratios of 'unhealthy' to 'healthy' outlets were highest in LGAs located in designated Growth Areas. Melbourne's metropolitan food environment is saturated by 'unhealthy' and 'less healthy' food outlets, relative to 'healthy' ones. Melbourne's urban growth areas had the least healthy food environments.
肥胖症的患病率在地理区域之间分布不均。食品环境可能导致健康差距,但人们对食品环境如何随时间演变以及这如何影响饮食摄入和体重知之甚少。本研究旨在分析澳大利亚墨尔本 2008 年至 2016 年间城市内部食品店密度和健康程度的差异。食品店数据按位置、类型和健康程度进行分类。地方政府区域 (LGA) 按距中央商务区的距离分为四组。每个 LGA 的住宅人口估计数用于计算每 10000 名居民的食品店密度。线性混合模型用于估计 LGA 组随时间变化的食品店平均密度和“健康”与“不健康”食品店的比例以及食品店“类型”。食品店数量的增长速度快于住宅人口,这是由“不健康”和“健康”食品店密度的增加所驱动的。在所有年份中,位于指定增长区的 LGA 的“不健康”与“健康”食品店的比例最高。与“健康”食品店相比,墨尔本的城市食品环境充斥着“不健康”和“不太健康”的食品店。墨尔本的城市增长区拥有最不健康的食品环境。