He Fengyu, Ding Shuangcheng, Wang Hongwei, Qin Feng
Engineering Research Center of Ecology and Agricultural Use of Wetland, Ministry of Education, Agricultural College, Yangtze University, Jingzhou, China.
Hubei Key Laboratory of Waterlogging Disaster and Agricultural Use of Wetland, Agricultural College, Yangtze University, Jingzhou, China.
Front Genet. 2020 Mar 20;11:260. doi: 10.3389/fgene.2020.00260. eCollection 2020.
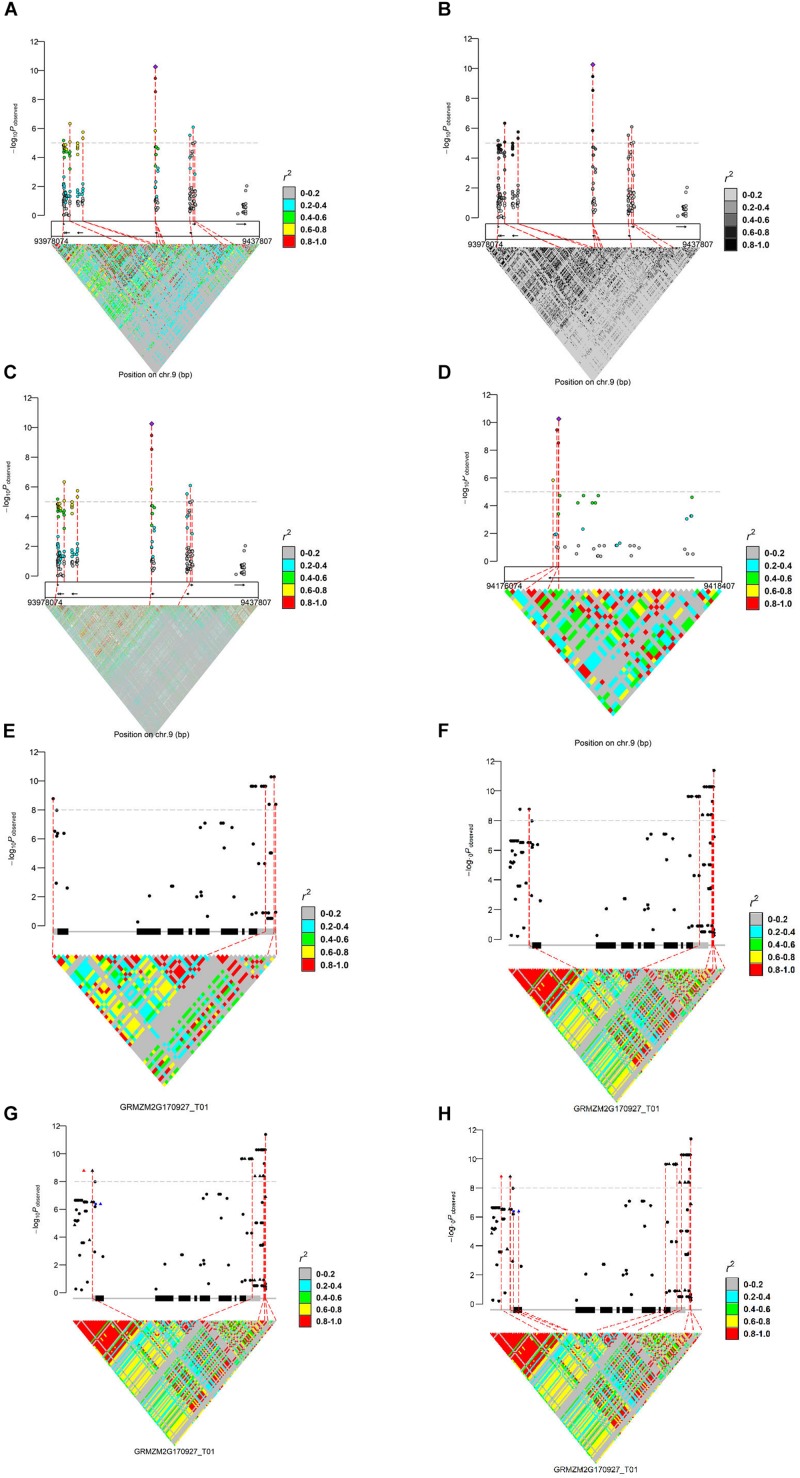
Genome-wide association study (GWAS), exploring the historical and evolutionary recombinations at the population level, is a major method adopted to identify quantitative trait loci (QTL) for complex traits. However, to summarize GWAS results, gene structure, and linkage disequilibrium (LD) in a single view, multiple tools are required. It is tedious to generate these three results and manually put them together; moreover, it may eventually lead to inaccuracies. On the other hand, genotype markers are usually detected by DNA- and/or RNA-Seq. For GWAS analysis based on RNA-Seq, markers from DNA-Seq provide more genetic information when displaying LD. The currently released software package does not have this function for an integrated analysis of LD, using genotypic markers different from that in association analysis. Here, we present an R package, IntAssoPlot, which provides an integrated visual display of GWAS results, along with LD and gene structure information, in a publication-ready format. The main panel of an IntAssoPlot plot has a connecting line linking the genome-wide association -values on the -log scale with the gene structure and LD matrix. Importantly, IntAssoPlot is designed to plot GWAS results with LD calculated from genotypes different from those in GWAS analysis. IntAssoPlot provides a powerful visualization tool to gain an integrated insight into GWAS results. The functions provided by IntAssoPlot increase the efficiency by revealing GWAS results in a publication-ready format. Inspection of the output image can provide important biological information, including the loci that passed the genome-wide significance threshold, genes located at or near the significant loci, and the extent of LD within the selected region.
全基因组关联研究(GWAS)旨在探索群体水平上的历史和进化重组,是识别复杂性状数量性状位点(QTL)所采用的主要方法。然而,要在一个视图中汇总GWAS结果、基因结构和连锁不平衡(LD),则需要多种工具。生成这三个结果并手动将它们放在一起很繁琐;此外,这最终可能会导致不准确。另一方面,基因型标记通常通过DNA测序和/或RNA测序来检测。对于基于RNA测序的GWAS分析,在展示LD时,来自DNA测序的标记可提供更多遗传信息。当前发布的软件包没有针对LD进行综合分析的功能,其使用的基因型标记与关联分析中的不同。在此,我们展示了一个R包IntAssoPlot,它以适合发表的格式提供GWAS结果、LD和基因结构信息的综合可视化展示。IntAssoPlot图的主面板有一条连接线,将对数尺度上的全基因组关联P值与基因结构和LD矩阵连接起来。重要的是,IntAssoPlot旨在用与GWAS分析中不同的基因型计算出的LD来绘制GWAS结果。IntAssoPlot提供了一个强大的可视化工具,以便对GWAS结果有综合的深入了解。IntAssoPlot提供的功能通过以适合发表的格式展示GWAS结果来提高效率。检查输出图像可提供重要的生物学信息,包括通过全基因组显著性阈值的位点、位于显著位点或其附近的基因,以及所选区域内的LD程度。