• 文献检索
  • 文档翻译
  • 深度研究
  • 学术资讯
  • Suppr Zotero 插件Zotero 插件
  • 邀请有礼
  • 套餐&价格
  • 历史记录
应用&插件
Suppr Zotero 插件Zotero 插件浏览器插件Mac 客户端Windows 客户端微信小程序
定价
高级版会员购买积分包购买API积分包
服务
文献检索文档翻译深度研究API 文档MCP 服务
关于我们
关于 Suppr公司介绍联系我们用户协议隐私条款
关注我们

Suppr 超能文献

核心技术专利:CN118964589B侵权必究
粤ICP备2023148730 号-1Suppr @ 2026

文献检索

告别复杂PubMed语法,用中文像聊天一样搜索,搜遍4000万医学文献。AI智能推荐,让科研检索更轻松。

立即免费搜索

文件翻译

保留排版,准确专业,支持PDF/Word/PPT等文件格式,支持 12+语言互译。

免费翻译文档

深度研究

AI帮你快速写综述,25分钟生成高质量综述,智能提取关键信息,辅助科研写作。

立即免费体验

我们能否预测 COVID-19 病例的发生?使用简单的增长模型进行考虑。

Can we predict the occurrence of COVID-19 cases? Considerations using a simple model of growth.

机构信息

Laboratory of Physics Applied to Soils and Environmental Sciences, Department of Physics, State University of Ponta Grossa (UEPG), 84.030-900 Ponta Grossa, PR, Brazil.

Laboratory of Physics Applied to Soils and Environmental Sciences, Department of Physics, State University of Ponta Grossa (UEPG), 84.030-900 Ponta Grossa, PR, Brazil.

出版信息

Sci Total Environ. 2020 Aug 1;728:138834. doi: 10.1016/j.scitotenv.2020.138834. Epub 2020 Apr 20.

DOI:10.1016/j.scitotenv.2020.138834
PMID:32334161
原文链接:https://pmc.ncbi.nlm.nih.gov/articles/PMC7194615/
Abstract

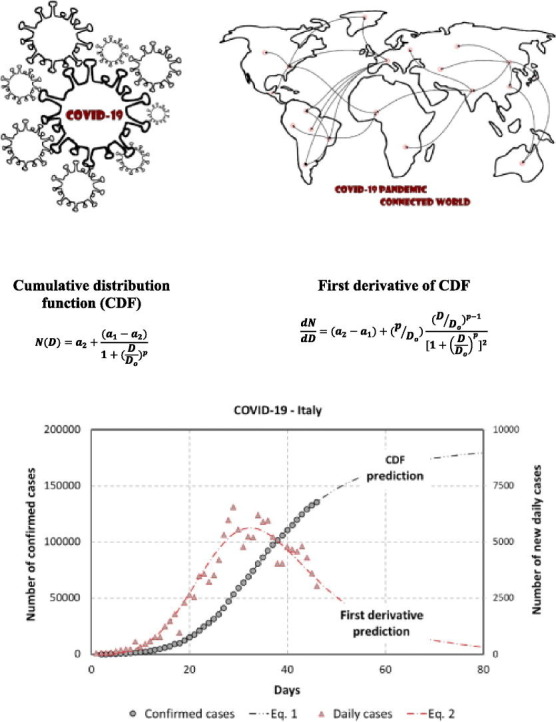
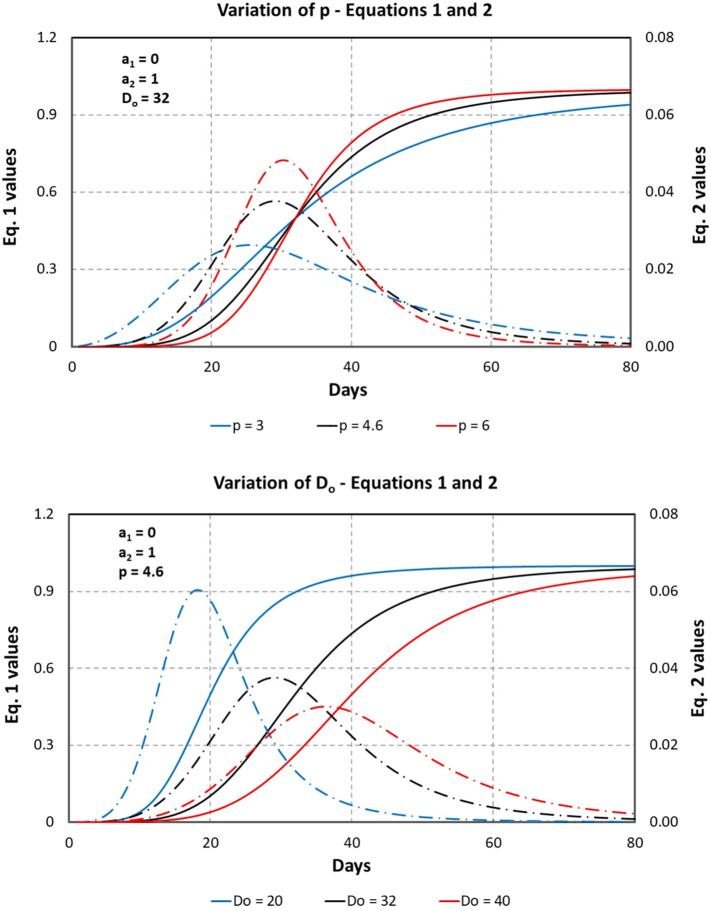
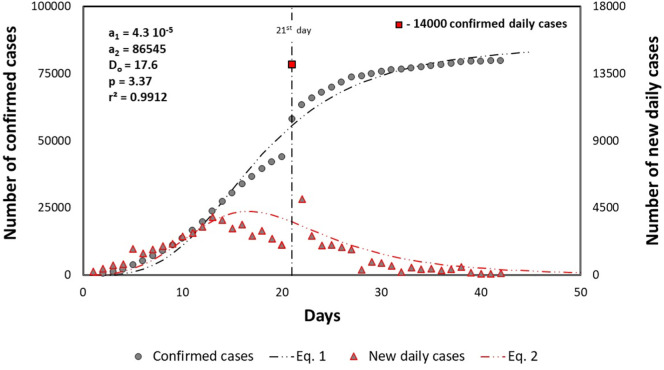
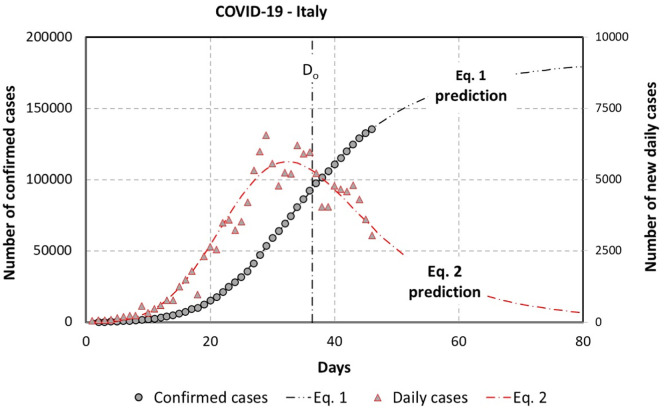
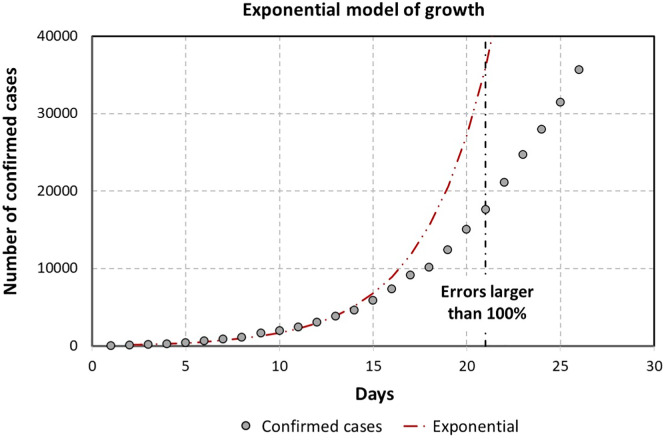
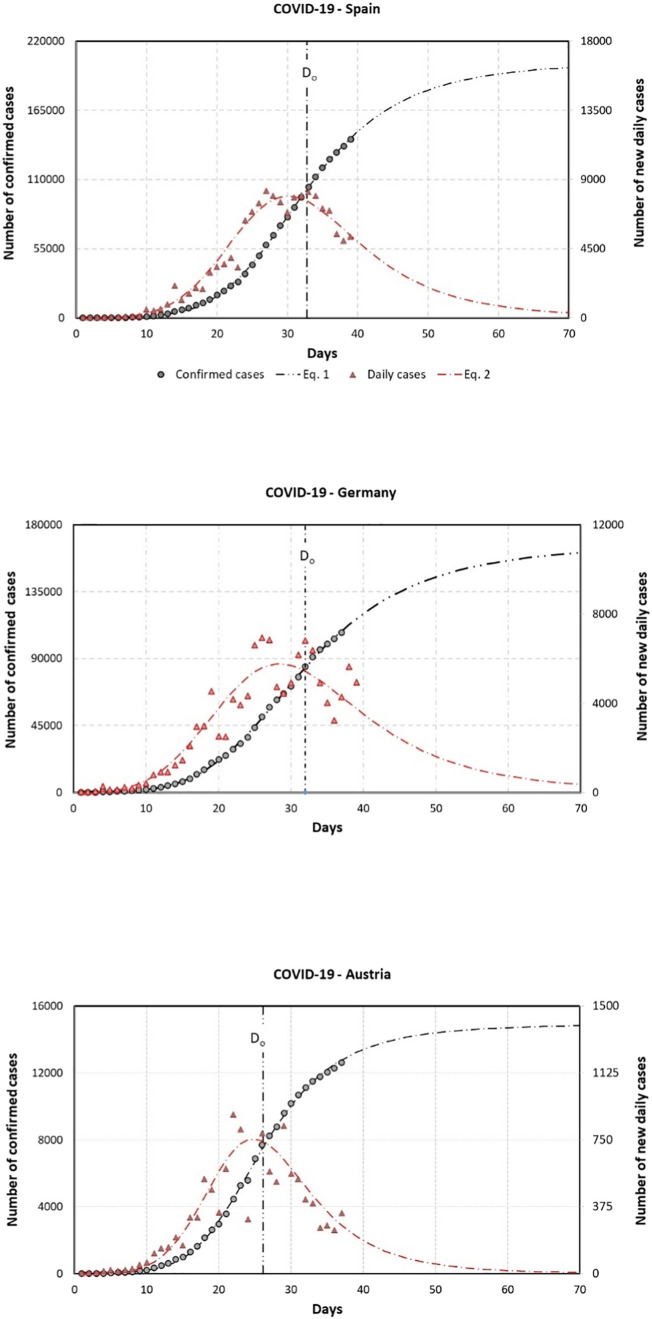
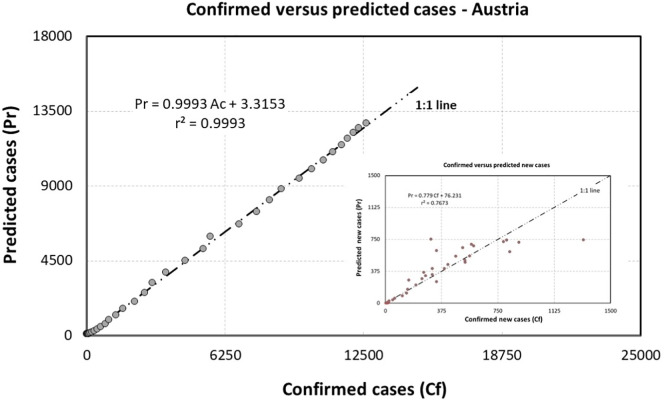
This study aimed to present a simple model to follow the evolution of the COVID-19 (CV-19) pandemic in different countries. The cumulative distribution function (CDF) and its first derivative were employed for this task. The simulations showed that it is almost impossible to predict based on the initial CV-19 cases (1st 2nd or 3rd weeks) how the pandemic will evolve. However, the results presented here revealed that this approach can be used as an alternative for the exponential growth model, traditionally employed as a prediction model, and serve as a valuable tool for investigating how protective measures are changing the evolution of the pandemic.

摘要

本研究旨在提出一个简单的模型来跟踪不同国家 COVID-19(CV-19)大流行的演变。该模型使用累积分布函数(CDF)及其一阶导数来实现这一目标。模拟结果表明,几乎不可能根据最初的 CV-19 病例(第 1、2 或 3 周)预测大流行将如何演变。然而,这里呈现的结果表明,这种方法可以替代传统上用作预测模型的指数增长模型,并作为研究保护措施如何改变大流行演变的有用工具。

https://cdn.ncbi.nlm.nih.gov/pmc/blobs/ad1e/7194615/21e3ca4664c8/gr6_lrg.jpg
https://cdn.ncbi.nlm.nih.gov/pmc/blobs/ad1e/7194615/abaeb08d54de/ga1_lrg.jpg
https://cdn.ncbi.nlm.nih.gov/pmc/blobs/ad1e/7194615/e697a7842dfb/gr1_lrg.jpg
https://cdn.ncbi.nlm.nih.gov/pmc/blobs/ad1e/7194615/9ca72148a020/gr2_lrg.jpg
https://cdn.ncbi.nlm.nih.gov/pmc/blobs/ad1e/7194615/a8a774111493/gr3_lrg.jpg
https://cdn.ncbi.nlm.nih.gov/pmc/blobs/ad1e/7194615/f9807ffa5292/gr4_lrg.jpg
https://cdn.ncbi.nlm.nih.gov/pmc/blobs/ad1e/7194615/acee6b1e86b3/gr5_lrg.jpg
https://cdn.ncbi.nlm.nih.gov/pmc/blobs/ad1e/7194615/21e3ca4664c8/gr6_lrg.jpg

相似文献

1
Can we predict the occurrence of COVID-19 cases? Considerations using a simple model of growth.我们能否预测 COVID-19 病例的发生?使用简单的增长模型进行考虑。
Sci Total Environ. 2020 Aug 1;728:138834. doi: 10.1016/j.scitotenv.2020.138834. Epub 2020 Apr 20.
2
[Forecasting the Pandemic: The Role of Mathematical Models].预测大流行:数学模型的作用
Acta Med Port. 2020 Nov 2;33(11):713-715. doi: 10.20344/amp.15049.
3
Predictive Mathematical Models of the COVID-19 Pandemic: Underlying Principles and Value of Projections.2019年冠状病毒病大流行的预测数学模型:基本原理与预测价值
JAMA. 2020 May 19;323(19):1893-1894. doi: 10.1001/jama.2020.6585.
4
How should we overcome the threat by the pandemic of 2019-nCoV? Epidemic simulation using the SIRS model.我们应如何克服2019新型冠状病毒疫情带来的威胁?使用SIRS模型进行疫情模拟。
Clin Rheumatol. 2020 Aug;39(8):2471-2473. doi: 10.1007/s10067-020-05083-7. Epub 2020 May 9.
5
Individual model forecasts can be misleading, but together they are useful.单个模型预测可能会产生误导,但综合起来它们是有用的。
Eur J Epidemiol. 2020 Aug;35(8):731-732. doi: 10.1007/s10654-020-00667-8. Epub 2020 Aug 11.
6
Research on COVID-19 based on ARIMA model-Taking Hubei, China as an example to see the epidemic in Italy.基于 ARIMA 模型的 COVID-19 研究——以中国湖北省为例,观察意大利的疫情。
J Infect Public Health. 2020 Oct;13(10):1415-1418. doi: 10.1016/j.jiph.2020.06.019. Epub 2020 Jun 20.
7
Short-term forecasting of daily COVID-19 cases in Brazil by using the Holt's model.使用霍尔特模型对巴西每日 COVID-19 病例进行短期预测。
Rev Soc Bras Med Trop. 2020 Jun 3;53:e20200283. doi: 10.1590/0037-8682-0283-2020. eCollection 2020.
8
Predicting covid-19 resurgence: do it locally.预测新冠疫情的卷土重来:因地制宜。
BMJ. 2020 Jul 9;370:m2731. doi: 10.1136/bmj.m2731.
9
The values and limitations of mathematical modelling to COVID-19 in the world: a follow up report.世界范围内 COVID-19 数学建模的价值和局限性:后续报告。
Emerg Microbes Infect. 2020 Dec;9(1):2465-2473. doi: 10.1080/22221751.2020.1843973.
10
Susceptible supply limits the role of climate in the early SARS-CoV-2 pandemic.易感性供应限制了气候在 SARS-CoV-2 大流行早期的作用。
Science. 2020 Jul 17;369(6501):315-319. doi: 10.1126/science.abc2535. Epub 2020 May 18.

引用本文的文献

1
Measuring influencing factors affecting mortality rates during the COVID-19 pandemic.测量 COVID-19 大流行期间影响死亡率的影响因素。
Glob Health Action. 2024 Dec 31;17(1):2428067. doi: 10.1080/16549716.2024.2428067. Epub 2024 Nov 12.
2
A comparative study for predictive monitoring of COVID-19 pandemic.一项关于新冠疫情预测性监测的对比研究。
Appl Soft Comput. 2022 Jun;122:108806. doi: 10.1016/j.asoc.2022.108806. Epub 2022 Apr 7.
3
Effect of Covid-19 lockdown on indian children with autism.新冠疫情封锁对印度自闭症儿童的影响。

本文引用的文献

1
Correlation between weather and Covid-19 pandemic in Jakarta, Indonesia.印度尼西亚雅加达的天气与新冠疫情的相关性
Sci Total Environ. 2020 Jul 10;725:138436. doi: 10.1016/j.scitotenv.2020.138436. Epub 2020 Apr 4.
2
The Italian health system and the COVID-19 challenge.意大利医疗体系与新冠疫情挑战
Lancet Public Health. 2020 May;5(5):e253. doi: 10.1016/S2468-2667(20)30074-8. Epub 2020 Mar 25.
3
COVID-19 in Europe: the Italian lesson.欧洲的新冠疫情:意大利的教训。
Res Dev Disabil. 2022 Jun;125:104230. doi: 10.1016/j.ridd.2022.104230. Epub 2022 Mar 30.
4
Applying Benford's law to COVID-19 data: the case of the European Union.运用本福德定律分析 COVID-19 数据:以欧盟为例。
J Public Health (Oxf). 2022 Jun 27;44(2):e221-e226. doi: 10.1093/pubmed/fdac005.
5
An Easy-to-Use Public Health-Driven Method (the Generalized Logistic Differential Equation Model) Accurately Simulated COVID-19 Epidemic in Wuhan and Correctly Determined the Early Warning Time.一种易于使用的公共卫生驱动方法(广义逻辑斯蒂微分方程模型)准确模拟了武汉的 COVID-19 疫情,并正确确定了预警时间。
Front Public Health. 2022 Mar 7;10:813860. doi: 10.3389/fpubh.2022.813860. eCollection 2022.
6
Machine learning techniques to predict different levels of hospital care of CoVid-19.用于预测新冠肺炎不同级别医院护理的机器学习技术。
Appl Intell (Dordr). 2022;52(6):6413-6431. doi: 10.1007/s10489-021-02743-2. Epub 2021 Sep 10.
7
Estimating the COVID-19 prevalence and mortality using a novel data-driven hybrid model based on ensemble empirical mode decomposition.基于集合经验模态分解的新型数据驱动混合模型估算 COVID-19 患病率和死亡率。
Sci Rep. 2021 Nov 1;11(1):21413. doi: 10.1038/s41598-021-00948-6.
8
Hospital preparedness during epidemics using simulation: the case of COVID-19.使用模拟方法评估医院在疫情期间的准备情况:以COVID-19为例
Cent Eur J Oper Res. 2022;30(1):213-249. doi: 10.1007/s10100-021-00779-w. Epub 2021 Sep 27.
9
Model-based ensembles: Lessons learned from retrospective analysis of COVID-19 infection forecasts across 10 countries.基于模型的集成:对 10 个国家 COVID-19 感染预测的回顾性分析中得到的经验教训。
Sci Total Environ. 2022 Feb 1;806(Pt 2):150639. doi: 10.1016/j.scitotenv.2021.150639. Epub 2021 Sep 27.
10
The Influence of COVID-19 Vaccination on Daily Cases, Hospitalization, and Death Rate in Tennessee, United States: Case Study.2019冠状病毒病疫苗接种对美国田纳西州每日病例、住院率和死亡率的影响:案例研究
JMIRx Med. 2021 Aug 12;2(3):e29324. doi: 10.2196/29324. eCollection 2021 Jul-Sep.
Lancet. 2020 Apr 4;395(10230):1110-1111. doi: 10.1016/S0140-6736(20)30690-5. Epub 2020 Mar 24.
4
COVID-19 and Italy: what next?COVID-19 和意大利:下一步如何?
Lancet. 2020 Apr 11;395(10231):1225-1228. doi: 10.1016/S0140-6736(20)30627-9. Epub 2020 Mar 13.
5
Improving environmental exposure analysis using cumulative distribution functions and individual geocoding.使用累积分布函数和个体地理编码改进环境暴露分析。
Int J Health Geogr. 2006 May 25;5:23. doi: 10.1186/1476-072X-5-23.