Data Analytics Research Center, Department of Medical and Surgical Sciences, University of Catanzaro, 88100 Catanzaro, Italy.
Int J Environ Res Public Health. 2020 Jun 12;17(12):4182. doi: 10.3390/ijerph17124182.
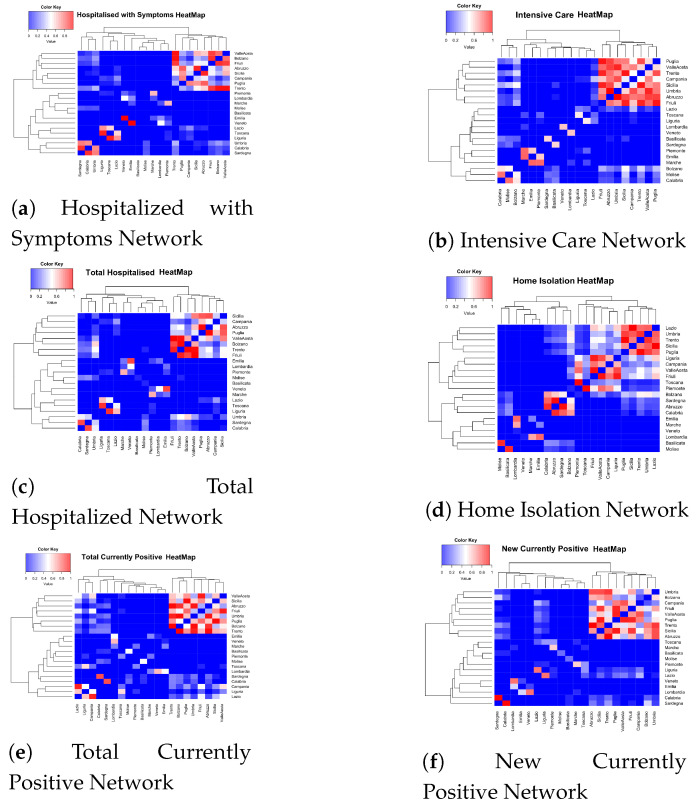
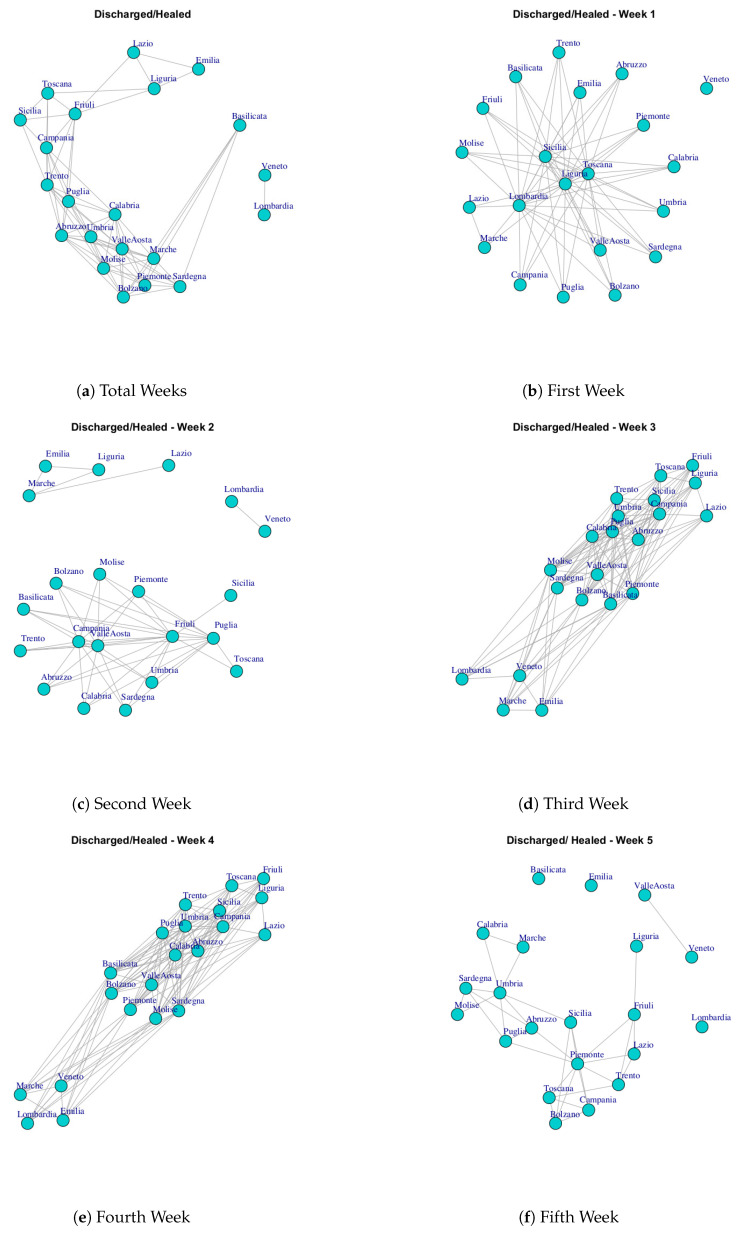
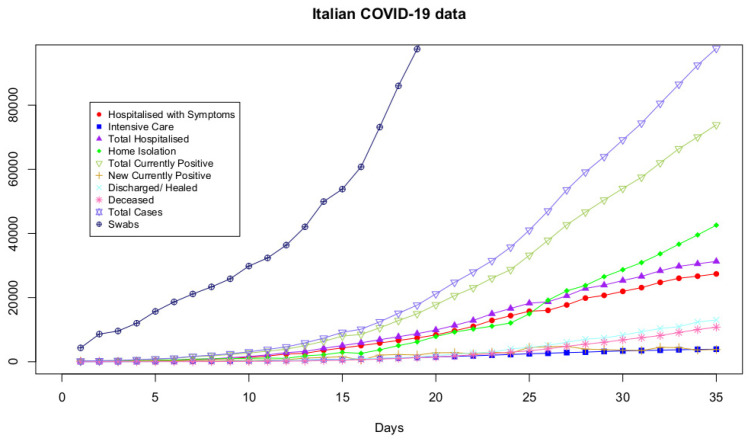
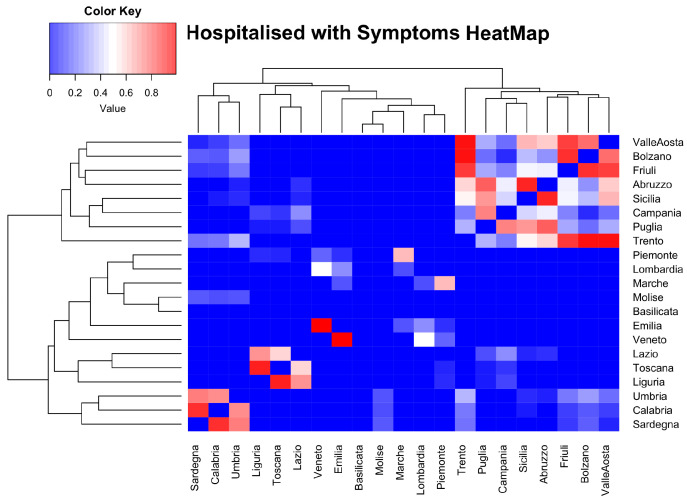
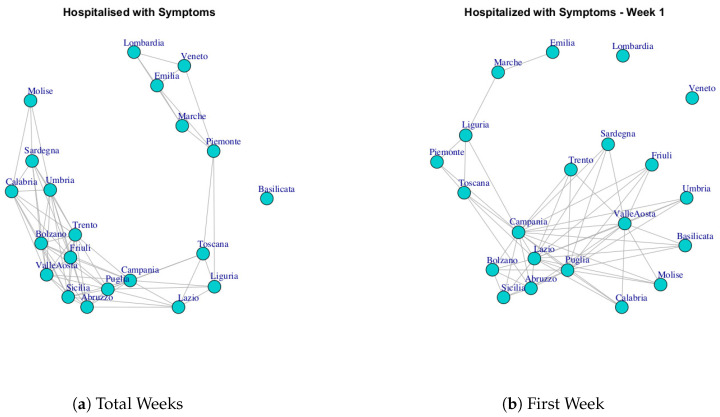
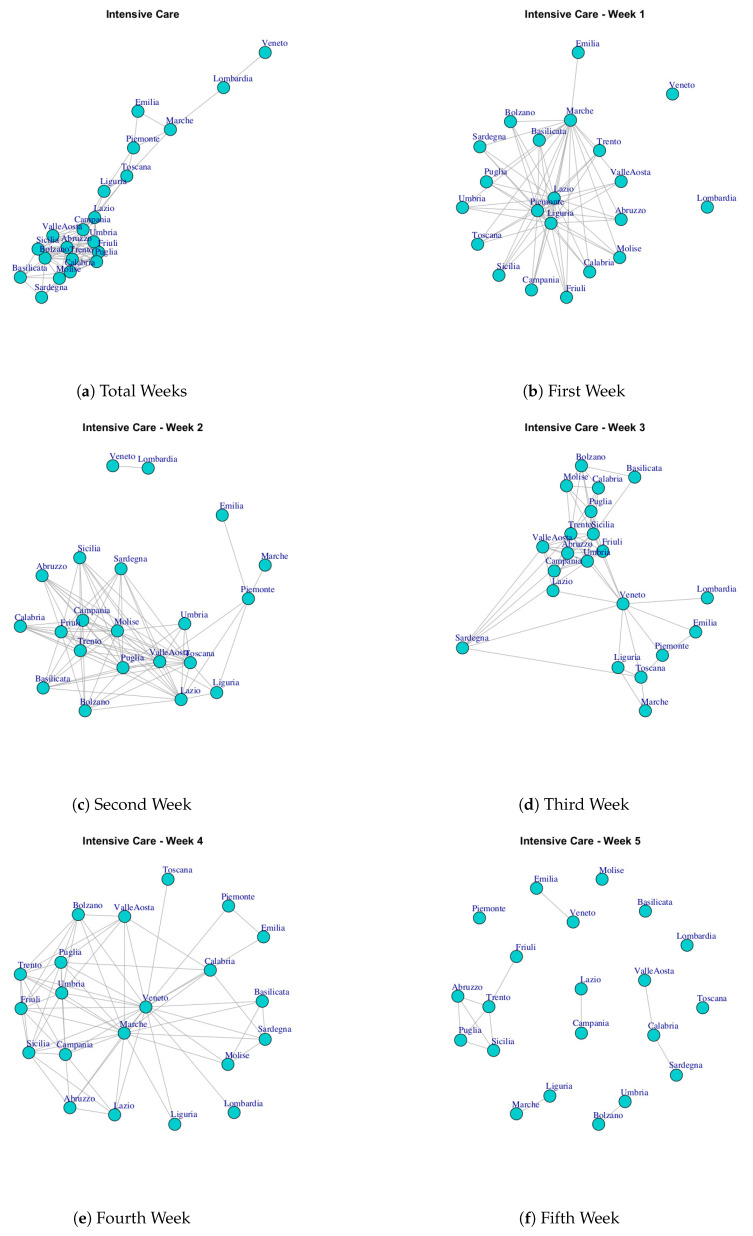
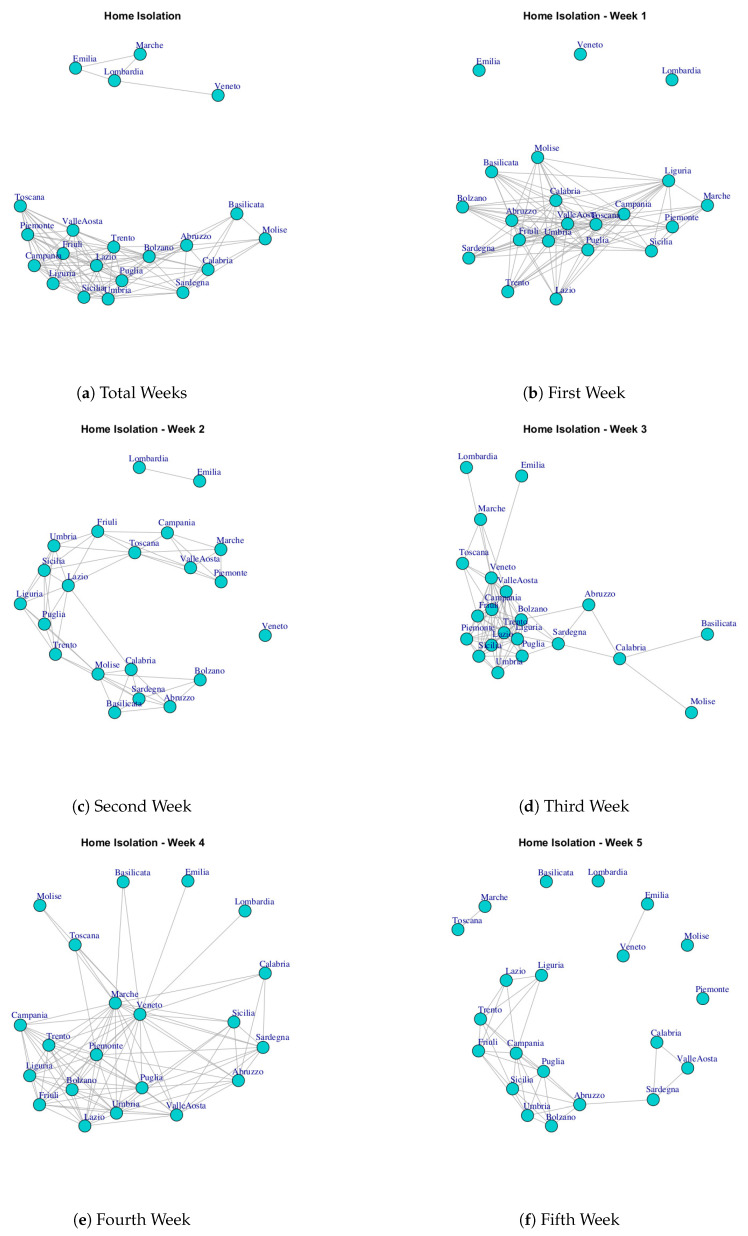
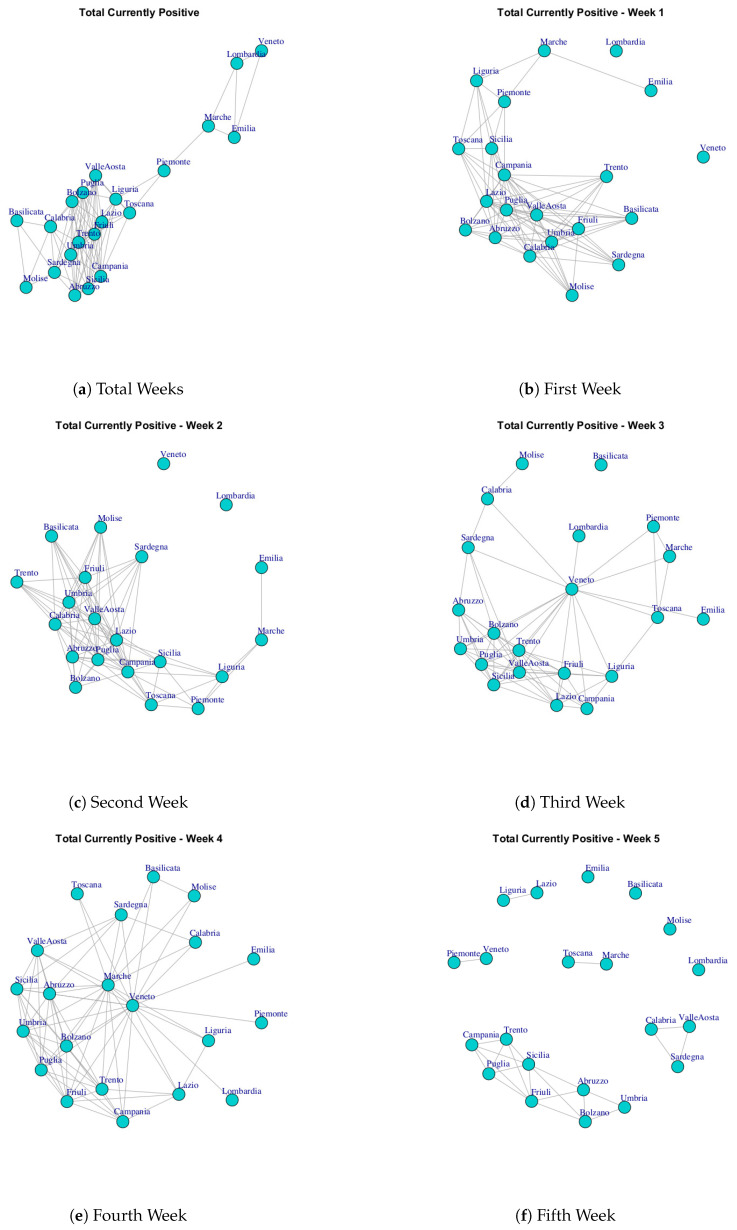
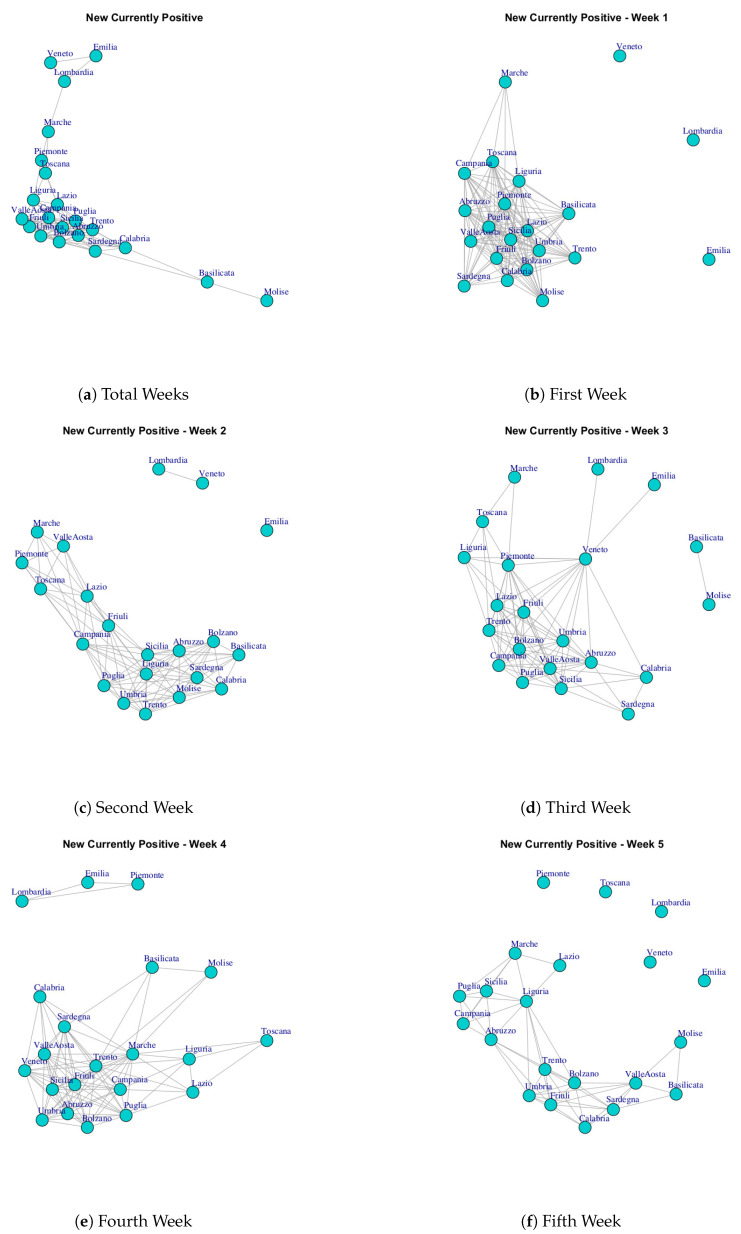
The coronavirus disease (COVID-19) outbreak started in Wuhan, China, and it has rapidly spread across the world. Italy is one of the European countries most affected by COVID-19, and it has registered high COVID-19 death rates and the death toll. In this article, we analyzed different Italian COVID-19 data at the regional level for the period 24 February to 29 March 2020. The analysis pipeline includes the following steps. After individuating groups of similar or dissimilar regions with respect to the ten types of available COVID-19 data using statistical test, we built several similarity matrices. Then, we mapped those similarity matrices into networks where nodes represent Italian regions and edges represent similarity relationships (edge length is inversely proportional to similarity). Then, network-based analysis was performed mainly discovering communities of regions that show similar behavior. In particular, network-based analysis was performed by running several community detection algorithms on those networks and by underlying communities of regions that show similar behavior. The network-based analysis of Italian COVID-19 data is able to elegantly show how regions form communities, i.e., how they join and leave them, along time and how community consistency changes along time and with respect to the different available data.
冠状病毒病(COVID-19)疫情始于中国武汉,已迅速蔓延至全球。意大利是受 COVID-19 影响最严重的欧洲国家之一,其 COVID-19 死亡率和死亡人数都很高。在本文中,我们分析了 2020 年 2 月 24 日至 3 月 29 日期间意大利各地区的不同 COVID-19 数据。分析流程包括以下步骤。使用统计检验,针对十种可用 COVID-19 数据中的每一种,确定具有相似或不同特征的地区组之后,我们构建了多个相似矩阵。然后,我们将这些相似矩阵映射到网络中,其中节点代表意大利地区,边代表相似关系(边的长度与相似性成反比)。然后,主要通过在这些网络上运行多个社区检测算法,并根据具有相似行为的地区的社区,进行基于网络的分析。对意大利 COVID-19 数据的网络分析能够优雅地展示地区如何形成社区,即它们随着时间的推移如何加入和离开社区,以及社区的一致性如何随时间变化以及与不同可用数据有关。