• 文献检索
  • 文档翻译
  • 深度研究
  • 学术资讯
  • Suppr Zotero 插件Zotero 插件
  • 邀请有礼
  • 套餐&价格
  • 历史记录
应用&插件
Suppr Zotero 插件Zotero 插件浏览器插件Mac 客户端Windows 客户端微信小程序
定价
高级版会员购买积分包购买API积分包
服务
文献检索文档翻译深度研究API 文档MCP 服务
关于我们
关于 Suppr公司介绍联系我们用户协议隐私条款
关注我们

Suppr 超能文献

核心技术专利:CN118964589B侵权必究
粤ICP备2023148730 号-1Suppr @ 2026

文献检索

告别复杂PubMed语法,用中文像聊天一样搜索,搜遍4000万医学文献。AI智能推荐,让科研检索更轻松。

立即免费搜索

文件翻译

保留排版,准确专业,支持PDF/Word/PPT等文件格式,支持 12+语言互译。

免费翻译文档

深度研究

AI帮你快速写综述,25分钟生成高质量综述,智能提取关键信息,辅助科研写作。

立即免费体验

伊朗2020年2月19日至6月14日期间冠状病毒(COVID-19)的空间建模、风险制图、变化检测及疫情趋势分析

Spatial modeling, risk mapping, change detection, and outbreak trend analysis of coronavirus (COVID-19) in Iran (days between February 19 and June 14, 2020).

作者信息

Pourghasemi Hamid Reza, Pouyan Soheila, Heidari Bahram, Farajzadeh Zakariya, Fallah Shamsi Seyed Rashid, Babaei Sedigheh, Khosravi Rasoul, Etemadi Mohammad, Ghanbarian Gholamabbas, Farhadi Ahmad, Safaeian Roja, Heidari Zahra, Tarazkar Mohammad Hassan, Tiefenbacher John P, Azmi Amir, Sadeghian Faezeh

机构信息

Department of Natural Resources and Environmental Engineering, College of Agriculture, Shiraz University, Shiraz, Iran.

Research Assistant, Department of Natural Resources and Environmental Engineering, College of Agriculture, Shiraz University, Shiraz, Iran.

出版信息

Int J Infect Dis. 2020 Sep;98:90-108. doi: 10.1016/j.ijid.2020.06.058. Epub 2020 Jun 20.

DOI:10.1016/j.ijid.2020.06.058
PMID:32574693
原文链接:https://pmc.ncbi.nlm.nih.gov/articles/PMC7305907/
Abstract

OBJECTIVES

Coronavirus disease 2019 (COVID-19) represents a major pandemic threat that has spread to more than 212 countries with more than 432,902 recorded deaths and 7,898,442 confirmed cases worldwide so far (on June 14, 2020). It is crucial to investigate the spatial drivers to prevent and control the epidemic of COVID-19.

METHODS

This is the first comprehensive study of COVID-19 in Iran; and it carries out spatial modeling, risk mapping, change detection, and outbreak trend analysis of the disease spread. Four main steps were taken: comparison of Iranian coronavirus data with the global trends, prediction of mortality trends using regression modeling, spatial modeling, risk mapping, and change detection using the random forest (RF) machine learning technique (MLT), and validation of the modeled risk map.

RESULTS

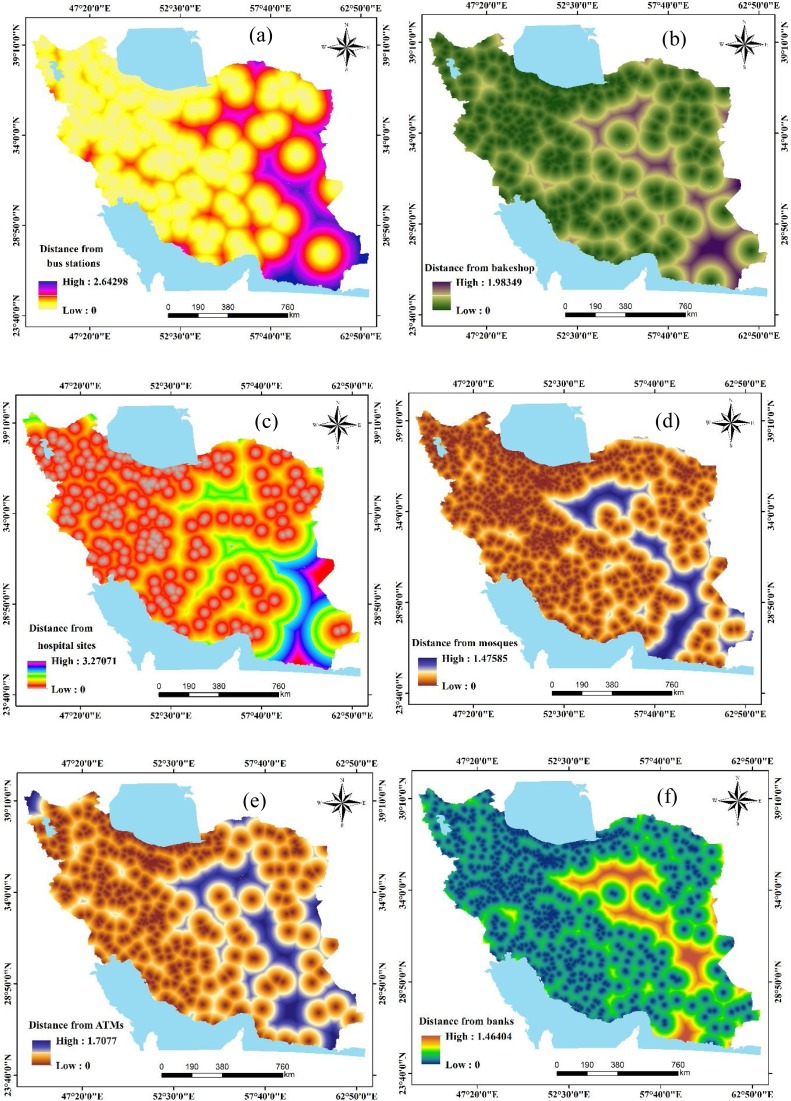
The results show that from February 19 to June 14, 2020, the average growth rates (GR) of COVID-19 deaths and the total number of COVID-19 cases in Iran were 1.08 and 1.10, respectively. Based on the World Health Organisation (WHO) data, Iran's fatality rate (deaths/0.1M pop) is 10.53. Other countries' fatality rates were, for comparison, Belgium - 83.32, UK - 61.39, Spain - 58.04, Italy - 56.73, Sweden - 48.28, France - 45.04, USA - 35.52, Canada - 21.49, Brazil - 20.10, Peru - 19.70, Chile - 16.20, Mexico- 12.80, and Germany - 10.58. The fatality rate for China is 0.32 (deaths/0.1M pop). Over time, the heatmap of the infected areas identified two critical time intervals for the COVID-19 outbreak in Iran. The provinces were classified in terms of disease and death rates into a large primary group and three provinces that had critical outbreaks were separate from the others. The heatmap of countries of the world shows that China and Italy were distinguished from other countries in terms of nine viral infection-related parameters. The regression models for death cases showed an increasing trend but with some evidence of turning. A polynomial relationship was identified between the coronavirus infection rate and the province population density. Also, a third-degree polynomial regression model for deaths showed an increasing trend recently, indicating that subsequent measures taken to cope with the outbreak have been insufficient and ineffective. The general trend of deaths in Iran is similar to the world's, but Iran's shows lower volatility. Change detection of COVID-19 risk maps with a random forest model for the period from March 11 to March 18 showed an increasing trend of COVID-19 in Iran's provinces. It is worth noting that using the LASSO MLT to evaluate variables' importance, indicated that the most important variables were the distance from bus stations, bakeries, hospitals, mosques, ATMs (automated teller machines), banks, and the minimum temperature of the coldest month.

CONCLUSIONS

We believe that this study's risk maps are the primary, fundamental step to take for managing and controlling COVID-19 in Iran and its provinces.

摘要

目标

2019年冠状病毒病(COVID-19)是一项重大的全球大流行威胁,截至2020年6月14日,已蔓延至212多个国家,全球有记录的死亡人数超过432,902人,确诊病例达7,898,442例。调查COVID-19疫情的空间驱动因素对于预防和控制该疾病至关重要。

方法

这是对伊朗COVID-19的首次全面研究;它对该疾病传播进行了空间建模、风险制图、变化检测和疫情趋势分析。采取了四个主要步骤:将伊朗冠状病毒数据与全球趋势进行比较,使用回归模型预测死亡率趋势,使用随机森林(RF)机器学习技术(MLT)进行空间建模、风险制图和变化检测,以及对建模的风险地图进行验证。

结果

结果显示,2020年2月19日至6月14日,伊朗COVID-19死亡人数和COVID-19病例总数的平均增长率(GR)分别为1.08和1.10。根据世界卫生组织(WHO)的数据,伊朗的病死率(死亡人数/10万人)为10.53。相比之下,其他国家的病死率分别为:比利时 - 83.32,英国 - 61.39,西班牙 - 58.04,意大利 - 56.73,瑞典 - 48.28,法国 - 45.04,美国 - 35.52,加拿大 - 21.49,巴西 - 20.10,秘鲁 - 19.70,智利 - 16.20,墨西哥 - 12.80,德国 - 10.58。中国的病死率为0.32(死亡人数/10万人)。随着时间推移,感染地区的热图确定了伊朗COVID-19疫情爆发的两个关键时间间隔。根据疾病和死亡率,各省份被分为一个大的主要组,三个疫情严重的省份与其他省份分开。世界各国的热图显示,中国和意大利在九个与病毒感染相关的参数方面与其他国家有所不同。死亡病例的回归模型显示呈上升趋势,但有一些转折迹象。确定了冠状病毒感染率与省份人口密度之间的多项式关系。此外,死亡人数的三次多项式回归模型最近显示呈上升趋势,表明随后为应对疫情采取的措施不足且无效。伊朗死亡人数的总体趋势与全球相似,但伊朗的波动较小。使用随机森林模型对2020年3月11日至3月18日期间的COVID-19风险地图进行变化检测,结果显示伊朗各省份的COVID-19呈上升趋势。值得注意的是,使用套索MLT评估变量的重要性表明,最重要的变量是与公交车站、面包店、医院、清真寺、自动取款机(ATM)、银行的距离以及最冷月份的最低温度。

结论

我们认为,本研究的风险地图是伊朗及其各省份管理和控制COVID-19的首要基本步骤。

https://cdn.ncbi.nlm.nih.gov/pmc/blobs/86c2/7305907/4a33e9a6144e/gr18_lrg.jpg
https://cdn.ncbi.nlm.nih.gov/pmc/blobs/86c2/7305907/45c75ae161c9/gr1_lrg.jpg
https://cdn.ncbi.nlm.nih.gov/pmc/blobs/86c2/7305907/f6fd119fd268/gr2_lrg.jpg
https://cdn.ncbi.nlm.nih.gov/pmc/blobs/86c2/7305907/6b039d35bf2c/gr3a_lrg.jpg
https://cdn.ncbi.nlm.nih.gov/pmc/blobs/86c2/7305907/72bc0eed1279/gr4_lrg.jpg
https://cdn.ncbi.nlm.nih.gov/pmc/blobs/86c2/7305907/9d6717a96f2a/gr5_lrg.jpg
https://cdn.ncbi.nlm.nih.gov/pmc/blobs/86c2/7305907/397c23836e38/gr6_lrg.jpg
https://cdn.ncbi.nlm.nih.gov/pmc/blobs/86c2/7305907/78ef01509511/gr7_lrg.jpg
https://cdn.ncbi.nlm.nih.gov/pmc/blobs/86c2/7305907/41e753302b88/gr8_lrg.jpg
https://cdn.ncbi.nlm.nih.gov/pmc/blobs/86c2/7305907/b781ae0fbc08/gr9_lrg.jpg
https://cdn.ncbi.nlm.nih.gov/pmc/blobs/86c2/7305907/83030318e825/gr10_lrg.jpg
https://cdn.ncbi.nlm.nih.gov/pmc/blobs/86c2/7305907/75e7997e8a52/gr11_lrg.jpg
https://cdn.ncbi.nlm.nih.gov/pmc/blobs/86c2/7305907/3f1962783317/gr12_lrg.jpg
https://cdn.ncbi.nlm.nih.gov/pmc/blobs/86c2/7305907/0268c61fe63d/gr13_lrg.jpg
https://cdn.ncbi.nlm.nih.gov/pmc/blobs/86c2/7305907/0dfed243f2ef/gr14_lrg.jpg
https://cdn.ncbi.nlm.nih.gov/pmc/blobs/86c2/7305907/e8ff776f6a55/gr15_lrg.jpg
https://cdn.ncbi.nlm.nih.gov/pmc/blobs/86c2/7305907/77bd68c93622/gr16_lrg.jpg
https://cdn.ncbi.nlm.nih.gov/pmc/blobs/86c2/7305907/be12132f933f/gr17_lrg.jpg
https://cdn.ncbi.nlm.nih.gov/pmc/blobs/86c2/7305907/4a33e9a6144e/gr18_lrg.jpg

相似文献

1
Spatial modeling, risk mapping, change detection, and outbreak trend analysis of coronavirus (COVID-19) in Iran (days between February 19 and June 14, 2020).伊朗2020年2月19日至6月14日期间冠状病毒(COVID-19)的空间建模、风险制图、变化检测及疫情趋势分析
Int J Infect Dis. 2020 Sep;98:90-108. doi: 10.1016/j.ijid.2020.06.058. Epub 2020 Jun 20.
2
Assessment of the outbreak risk, mapping and infection behavior of COVID-19: Application of the autoregressive integrated-moving average (ARIMA) and polynomial models.评估 COVID-19 的暴发风险、绘制疫情地图及感染行为:自回归求和移动平均 (ARIMA) 模型和多项式模型的应用。
PLoS One. 2020 Jul 28;15(7):e0236238. doi: 10.1371/journal.pone.0236238. eCollection 2020.
3
Climate and COVID-19 pandemic: effect of heat and humidity on the incidence and mortality in world's top ten hottest and top ten coldest countries.气候与 COVID-19 大流行:高温和高湿度对世界十大最炎热和十大最寒冷国家发病率和死亡率的影响。
Eur Rev Med Pharmacol Sci. 2020 Aug;24(15):8232-8238. doi: 10.26355/eurrev_202008_22513.
4
Epidemiological characteristics of coronavirus disease 2019 (COVID-19) patients in IRAN: A single center study.伊朗 2019 冠状病毒病(COVID-19)患者的流行病学特征:一项单中心研究。
J Clin Virol. 2020 Jun;127:104378. doi: 10.1016/j.jcv.2020.104378. Epub 2020 Apr 21.
5
Geographic risk assessment of COVID-19 transmission using recent data: An observational study.利用近期数据进行新冠病毒传播的地理风险评估:一项观察性研究。
Medicine (Baltimore). 2020 Jun 12;99(24):e20774. doi: 10.1097/MD.0000000000020774.
6
Prediction of the COVID-19 Pandemic for the Top 15 Affected Countries: Advanced Autoregressive Integrated Moving Average (ARIMA) Model.预测受 COVID-19 影响最严重的 15 个国家:高级自回归综合移动平均 (ARIMA) 模型。
JMIR Public Health Surveill. 2020 May 13;6(2):e19115. doi: 10.2196/19115.
7
The association between the incidence of COVID-19 and the distance from the virus epicenter in Iran.伊朗新冠病毒发病率与病毒中心距离的关系。
Arch Virol. 2020 Nov;165(11):2555-2560. doi: 10.1007/s00705-020-04774-5. Epub 2020 Sep 2.
8
A Model for COVID-19 Prediction in Iran Based on China Parameters.基于中国参数的伊朗 COVID-19 预测模型。
Arch Iran Med. 2020 Apr 1;23(4):244-248. doi: 10.34172/aim.2020.05.
9
COVID-19, Australia: Epidemiology Report 17 (Fortnightly reporting period ending 24 May 2020).2019冠状病毒病,澳大利亚:流行病学报告第17期(截至2020年5月24日的两周报告期)
Commun Dis Intell (2018). 2020 Jun 5;44. doi: 10.33321/cdi.2020.44.51.
10
Should we remain hopeful? The key 8 weeks: spatiotemporal epidemic characteristics of COVID-19 in Sichuan Province and its comparative analysis with other provinces in China and global epidemic trends.我们是否应该保持希望?关键的 8 周:四川省 COVID-19 的时空流行特征及其与中国其他省份和全球流行趋势的比较分析。
BMC Infect Dis. 2020 Nov 5;20(1):807. doi: 10.1186/s12879-020-05494-6.

引用本文的文献

1
Detecting the Seasonal and Spatial Patterns of COVID-19 Hospitalization and Deaths in Iran: Insights from a Spatiotemporal and Hotspot Analysis.检测伊朗新冠肺炎住院和死亡的季节性及空间模式:时空与热点分析的见解
Int J Prev Med. 2025 Apr 24;16:20. doi: 10.4103/ijpvm.ijpvm_146_24. eCollection 2025.
2
Spatio-temporal forecasting of COVID-19 cases in the Netherlands for source and contact tracing.荷兰新冠病毒疾病病例的时空预测,用于源头追踪和接触者追踪。
Int J Popul Data Sci. 2025 May 7;10(1):2703. doi: 10.23889/ijpds.v10i1.2703. eCollection 2025.
3
Machine learning-based prediction of pulmonary embolism to reduce unnecessary computed tomography scans in gastrointestinal cancer patients: a retrospective multicenter study.

本文引用的文献

1
The role of environmental factors on transmission rates of the COVID-19 outbreak: an initial assessment in two spatial scales.环境因素对 COVID-19 爆发传播率的影响:两个空间尺度上的初步评估。
Sci Rep. 2020 Oct 12;10(1):17002. doi: 10.1038/s41598-020-74089-7.
2
Has SARS infected the property market? Evidence from Hong Kong.非典疫情影响房地产市场了吗?来自香港的证据。
J Urban Econ. 2008 Jan;63(1):74-95. doi: 10.1016/j.jue.2006.12.007. Epub 2007 Feb 1.
3
Application of learning vector quantization and different machine learning techniques to assessing forest fire influence factors and spatial modelling.
基于机器学习的肺栓塞预测模型以减少胃肠道癌症患者不必要的 CT 扫描:一项回顾性多中心研究。
Sci Rep. 2024 Oct 25;14(1):25359. doi: 10.1038/s41598-024-75977-y.
4
Do COVID-19 Infectious Disease Models Incorporate the Social Determinants of Health? A Systematic Review.2019冠状病毒病传染病模型纳入了健康的社会决定因素吗?一项系统综述。
Public Health Rev. 2024 Oct 10;45:1607057. doi: 10.3389/phrs.2024.1607057. eCollection 2024.
5
Hierarchical Bayesian spatio-temporal modeling of COVID-19 in the United States.美国新冠肺炎的分层贝叶斯时空建模
J Appl Stat. 2022 May 16;50(11-12):2663-2680. doi: 10.1080/02664763.2022.2069232. eCollection 2023.
6
Risk perception and avoidance of preventive behavior on the COVID-19 among cancer patients.癌症患者对新冠病毒疾病的风险认知与预防行为规避
Health Sci Rep. 2023 Jul 8;6(7):e1401. doi: 10.1002/hsr2.1401. eCollection 2023 Jul.
7
Critical air pollutant assessments and health effects attributed to PM during and after COVID-19 lockdowns in Iran: application of AirQ models.伊朗新冠疫情封锁期间和之后的关键空气污染物评估及与 PM 相关的健康影响:AirQ 模型的应用。
Front Public Health. 2023 May 25;11:1120694. doi: 10.3389/fpubh.2023.1120694. eCollection 2023.
8
The utility of Zip4 codes in spatial epidemiological analysis.Zip4 码在空间流行病学分析中的应用。
PLoS One. 2023 May 31;18(5):e0285552. doi: 10.1371/journal.pone.0285552. eCollection 2023.
9
Computer-Aided Diagnosis of COVID-19 from Chest X-ray Images Using Hybrid-Features and Random Forest Classifier.基于混合特征和随机森林分类器的胸部X光图像对COVID-19的计算机辅助诊断
Healthcare (Basel). 2023 Mar 13;11(6):837. doi: 10.3390/healthcare11060837.
10
Space and social distancing in managing and preventing COVID-19 community spread: An overview.管理和预防新冠病毒社区传播中的空间与社交距离:概述
Heliyon. 2023 Mar;9(3):e13879. doi: 10.1016/j.heliyon.2023.e13879. Epub 2023 Feb 20.
学习矢量量化及其不同机器学习技术在评估森林火灾影响因素和空间建模中的应用。
Environ Res. 2020 May;184:109321. doi: 10.1016/j.envres.2020.109321. Epub 2020 Feb 29.
4
From SARS to COVID-19: A previously unknown SARS- related coronavirus (SARS-CoV-2) of pandemic potential infecting humans - Call for a One Health approach.从非典到新冠肺炎:一种具有大流行潜力、此前未知的与非典相关的冠状病毒(严重急性呼吸综合征冠状病毒2)感染人类——呼吁采取一体化健康方法。
One Health. 2020 Feb 24;9:100124. doi: 10.1016/j.onehlt.2020.100124. eCollection 2020 Jun.
5
Asymptomatic carrier state, acute respiratory disease, and pneumonia due to severe acute respiratory syndrome coronavirus 2 (SARS-CoV-2): Facts and myths.无症状携带者状态、急性呼吸道疾病和严重急性呼吸综合征冠状病毒 2(SARS-CoV-2)引起的肺炎:事实与误区。
J Microbiol Immunol Infect. 2020 Jun;53(3):404-412. doi: 10.1016/j.jmii.2020.02.012. Epub 2020 Mar 4.
6
A Comparative Study on the Clinical Features of Coronavirus 2019 (COVID-19) Pneumonia With Other Pneumonias.新型冠状病毒肺炎与其他肺炎的临床特征比较研究。
Clin Infect Dis. 2020 Jul 28;71(15):756-761. doi: 10.1093/cid/ciaa247.
7
China bans cash rewards for publishing papers.中国禁止对发表论文给予现金奖励。
Nature. 2020 Mar;579(7797):18. doi: 10.1038/d41586-020-00574-8.
8
Coronavirus Disease 2019: Coronaviruses and Blood Safety.2019 年冠状病毒病:冠状病毒与血液安全。
Transfus Med Rev. 2020 Apr;34(2):75-80. doi: 10.1016/j.tmrv.2020.02.003. Epub 2020 Feb 21.
9
Preliminary Identification of Potential Vaccine Targets for the COVID-19 Coronavirus (SARS-CoV-2) Based on SARS-CoV Immunological Studies.基于 SARS-CoV 免疫学研究的 COVID-19 冠状病毒(SARS-CoV-2)潜在疫苗靶点的初步鉴定。
Viruses. 2020 Feb 25;12(3):254. doi: 10.3390/v12030254.
10
Estimation of the reproductive number of novel coronavirus (COVID-19) and the probable outbreak size on the Diamond Princess cruise ship: A data-driven analysis.基于数据的新型冠状病毒(COVID-19)繁殖数和“钻石公主”号游轮上可能的疫情规模估计。
Int J Infect Dis. 2020 Apr;93:201-204. doi: 10.1016/j.ijid.2020.02.033. Epub 2020 Feb 22.