Direction of Epidemiology and Disease Control, MoH, Rabat, Morocco.
Centers for Disease Control and Prevention, Atlanta, USA.
BMC Public Health. 2020 Jun 29;20(1):1029. doi: 10.1186/s12889-020-09145-y.
Several statistical methods of variable complexity have been developed to establish thresholds for influenza activity that may be used to inform public health guidance. We compared the results of two methods and explored how they worked to characterize the 2018 influenza season performance-2018 season.
Historical data from the 2005/2006 to 2016/2018 influenza season performance seasons were provided by a network of 412 primary health centers in charge of influenza like illness (ILI) sentinel surveillance. We used the WHO averages and the moving epidemic method (MEM) to evaluate the proportion of ILI visits among all outpatient consultations (ILI%) as a proxy for influenza activity. We also used the MEM method to evaluate three seasons of composite data (ILI% multiplied by percent of ILI with laboratory-confirmed influenza) as recommended by WHO.
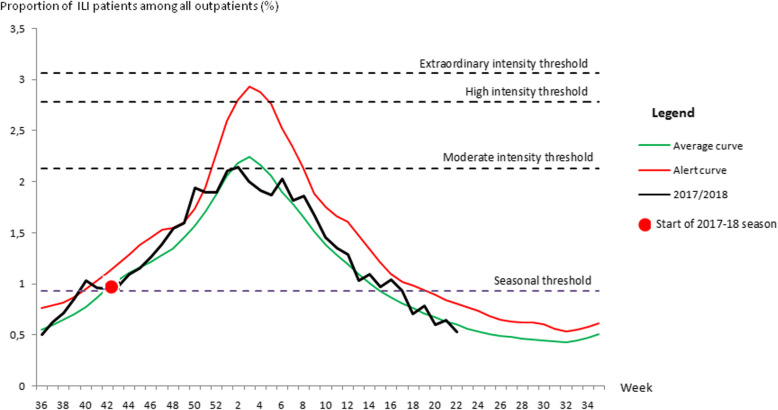
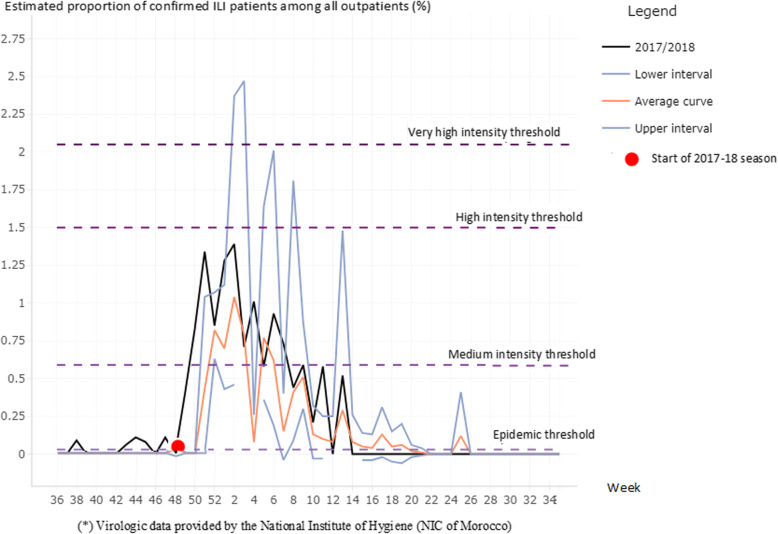
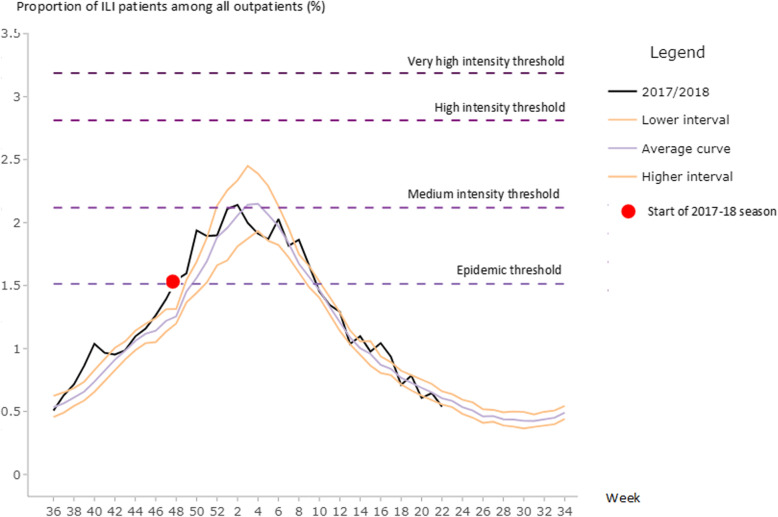
The WHO method estimated the seasonal ILI% threshold at 0.9%. The annual epidemic period began on average at week 46 and lasted an average of 18 weeks. The MEM model estimated the epidemic threshold (corresponding to the WHO seasonal threshold) at 1.5% of ILI visits among all outpatient consultations. The annual epidemic period began on week 49 and lasted on average 14 weeks. Intensity thresholds were similar using both methods. When using the composite measure, the MEM method showed a clearer estimate of the beginning of the influenza epidemic, which was coincident with a sharp increase in confirmed ILI cases.
We found that the threshold methodology presented in the WHO manual is simple to implement and easy to adopt for use by the Moroccan influenza surveillance system. The MEM method is more statistically sophisticated and may allow a better detection of the start of seasonal epidemics. Incorporation of virologic data into the composite parameter as recommended by WHO has the potential to increase the accuracy of seasonal threshold estimation.
已经开发出了几种具有不同复杂程度的统计方法来建立流感活动的阈值,这些阈值可用于为公共卫生指导提供信息。我们比较了两种方法的结果,并探讨了它们如何用于描述 2018 年流感季节表现。
由负责流感样疾病(ILI)哨点监测的 412 个初级保健中心网络提供了 2005/2006 至 2016/2018 年流感季节表现季节的历史数据。我们使用世界卫生组织(WHO)平均值和移动流行方法(MEM)来评估ILI 就诊占所有门诊就诊(ILI%)的比例作为流感活动的替代指标。我们还使用 MEM 方法来评估 WHO 推荐的三个复合数据季节(ILI%乘以实验室确诊流感的 ILI%)。
WHO 方法估计季节性 ILI%阈值为 0.9%。年度流行期平均于第 46 周开始,持续 18 周。MEM 模型估计流行阈值(相当于 WHO 季节性阈值)为所有门诊就诊中 ILI 就诊的 1.5%。年度流行期平均于第 49 周开始,持续 14 周。两种方法的强度阈值相似。当使用复合指标时,MEM 方法更清楚地估计了流感流行的开始,这与确诊 ILI 病例的急剧增加相吻合。
我们发现,WHO 手册中介绍的阈值方法简单易行,易于被摩洛哥流感监测系统采用。MEM 方法更具统计学复杂性,可能更有助于检测季节性流行的开始。如 WHO 所建议,将病毒学数据纳入复合参数中有可能提高季节性阈值估计的准确性。