• 文献检索
  • 文档翻译
  • 深度研究
  • 学术资讯
  • Suppr Zotero 插件Zotero 插件
  • 邀请有礼
  • 套餐&价格
  • 历史记录
应用&插件
Suppr Zotero 插件Zotero 插件浏览器插件Mac 客户端Windows 客户端微信小程序
定价
高级版会员购买积分包购买API积分包
服务
文献检索文档翻译深度研究API 文档MCP 服务
关于我们
关于 Suppr公司介绍联系我们用户协议隐私条款
关注我们

Suppr 超能文献

核心技术专利:CN118964589B侵权必究
粤ICP备2023148730 号-1Suppr @ 2026

文献检索

告别复杂PubMed语法,用中文像聊天一样搜索,搜遍4000万医学文献。AI智能推荐,让科研检索更轻松。

立即免费搜索

文件翻译

保留排版,准确专业,支持PDF/Word/PPT等文件格式,支持 12+语言互译。

免费翻译文档

深度研究

AI帮你快速写综述,25分钟生成高质量综述,智能提取关键信息,辅助科研写作。

立即免费体验

五个印度特大城市的颗粒物(PM)超标和趋势。

Exceedances and trends of particulate matter (PM) in five Indian megacities.

机构信息

National Atmospheric Research Laboratory, Gadanki, AP, India.

National Atmospheric Research Laboratory, Gadanki, AP, India.

出版信息

Sci Total Environ. 2021 Jan 1;750:141461. doi: 10.1016/j.scitotenv.2020.141461. Epub 2020 Aug 11.

DOI:10.1016/j.scitotenv.2020.141461
PMID:32882489
原文链接:https://pmc.ncbi.nlm.nih.gov/articles/PMC7417276/
Abstract

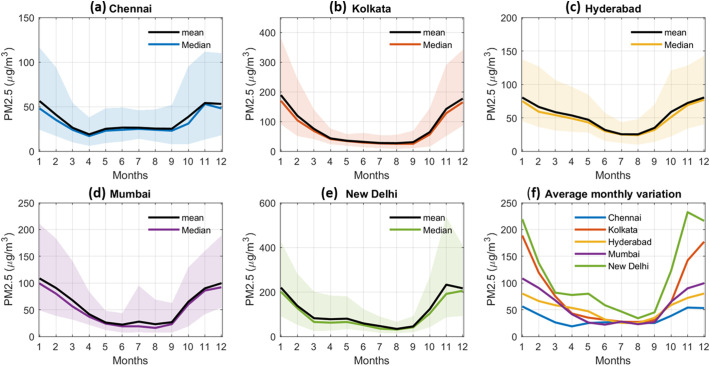
Fine particulate matter (PM) is the leading environmental risk factor that requires regular monitoring and analysis for effective air quality management. This work presents the variability, trend, and exceedance analysis of PM measured at US Embassy and Consulate in five Indian megacities (Chennai, Kolkata, Hyderabad, Mumbai, and New Delhi) for six years (2014-2019). Among all cities, Delhi is found to be the most polluted city followed by Kolkata, Mumbai, Hyderabad, and Chennai. The trend analysis for six years for five megacities suggests a statistically significant decreasing trend ranging from 1.5 to 4.19 μg/m (2%-8%) per year. Distinct diurnal, seasonal, and monthly variations are observed in the five cities due to the different site locations and local meteorology. All cities show the highest and lowest concentrations in the winter and monsoon months respectively except for Chennai which observed the lowest levels in April. All the cities consistently show morning peaks (08: 00-10:00 h) and the lowest level in late afternoon hours (15:00-16:00 h). We found that the PM levels in the cities exceed WHO standards and Indian NAAQS for 50% and 33% of days in a year except for Chennai. Delhi is found to have more than 200 days of exceedances in a year and experiences an average 15 number of episodes per year when the level exceeds the Indian NAAQS. The trends in the exceedance with a varying threshold (20-380 μg/m) suggest that not only is the annual mean PM decreasing in Delhi but also the number of exceedances is decreasing. This decrease can be attributed to the recent policies and regulations implemented in Delhi and other cities for the abatement of air pollution. However, stricter compliance of the National Clean Air Program (NCAP) policies can further accelerate the reduction of the pollution levels.

摘要

细颗粒物(PM)是主要的环境风险因素,需要进行定期监测和分析,以实现有效的空气质量管理。本研究报告了在印度五个特大城市(钦奈、加尔各答、海德拉巴、孟买和新德里)的美国大使馆和领事馆六年(2014-2019 年)期间测量的 PM 的可变性、趋势和超标分析。在所有城市中,德里被认为是污染最严重的城市,其次是加尔各答、孟买、海德拉巴和钦奈。五年特大城市的六年趋势分析表明,每年的浓度呈统计学显著下降趋势,范围为 1.5 至 4.19μg/m(2%-8%)。由于不同的站点位置和当地气象条件,五个城市的 PM 存在明显的日、季、月变化。除了钦奈,所有城市在冬季和季风月份的浓度最高和最低,除了钦奈,所有城市在冬季和季风月份的浓度最高和最低。除了钦奈,所有城市都显示出早晨高峰(约 08:00-10:00 h)和下午晚些时候(约 15:00-16:00 h)的最低水平。我们发现,除了钦奈外,这些城市的 PM 水平在一年中的 50%和 33%的天数超过了世卫组织标准和印度国家空气质量标准。德里每年有超过 200 天的超标天数,当水平超过印度国家空气质量标准时,每年平均有 15 次超标事件。随着阈值(20-380μg/m)的变化,超标趋势表明,德里不仅每年的平均 PM 浓度在下降,而且超标天数也在减少。这种下降可以归因于德里和其他城市最近实施的减少空气污染的政策和法规。然而,更严格地遵守国家清洁空气计划(NCAP)政策可以进一步加速污染水平的降低。

https://cdn.ncbi.nlm.nih.gov/pmc/blobs/541a/7417276/27563adbdb0f/gr7_lrg.jpg
https://cdn.ncbi.nlm.nih.gov/pmc/blobs/541a/7417276/2645c2bd2274/ga1_lrg.jpg
https://cdn.ncbi.nlm.nih.gov/pmc/blobs/541a/7417276/0e4dff53806e/gr1_lrg.jpg
https://cdn.ncbi.nlm.nih.gov/pmc/blobs/541a/7417276/2bfe9aa01343/gr2_lrg.jpg
https://cdn.ncbi.nlm.nih.gov/pmc/blobs/541a/7417276/b65a95b91a03/gr3_lrg.jpg
https://cdn.ncbi.nlm.nih.gov/pmc/blobs/541a/7417276/ff7e88c78736/gr4_lrg.jpg
https://cdn.ncbi.nlm.nih.gov/pmc/blobs/541a/7417276/83133af1cd75/gr5_lrg.jpg
https://cdn.ncbi.nlm.nih.gov/pmc/blobs/541a/7417276/2b03ddbb68fd/gr6_lrg.jpg
https://cdn.ncbi.nlm.nih.gov/pmc/blobs/541a/7417276/27563adbdb0f/gr7_lrg.jpg

相似文献

1
Exceedances and trends of particulate matter (PM) in five Indian megacities.五个印度特大城市的颗粒物(PM)超标和趋势。
Sci Total Environ. 2021 Jan 1;750:141461. doi: 10.1016/j.scitotenv.2020.141461. Epub 2020 Aug 11.
2
Impact of COVID-19 lockdown on ambient air quality in megacities of India and implication for air pollution control strategies.新冠疫情封锁对印度特大城市空气质量的影响及其对空气污染控制策略的启示。
Environ Sci Pollut Res Int. 2021 May;28(17):21621-21632. doi: 10.1007/s11356-020-11808-7. Epub 2021 Jan 7.
3
Frequency distribution of pollutant concentrations over Indian megacities impacted by the COVID-19 lockdown.受 COVID-19 封锁影响的印度特大城市污染物浓度的频数分布。
Environ Sci Pollut Res Int. 2022 Dec;29(57):85676-85687. doi: 10.1007/s11356-021-16874-z. Epub 2021 Oct 21.
4
Temporary reduction in fine particulate matter due to 'anthropogenic emissions switch-off' during COVID-19 lockdown in Indian cities.印度城市在新冠疫情封锁期间因“人为排放关停”导致细颗粒物暂时减少。
Sustain Cities Soc. 2020 Nov;62:102382. doi: 10.1016/j.scs.2020.102382. Epub 2020 Jul 13.
5
On processes controlling fine particulate matters in four Indian megacities.关于控制四个印度特大城市中细颗粒物的过程。
Environ Pollut. 2019 Nov;254(Pt A):113026. doi: 10.1016/j.envpol.2019.113026. Epub 2019 Aug 8.
6
The changing PM2.5 dynamics of global megacities based on long-term remotely sensed observations.基于长期遥感观测的全球特大城市 PM2.5 动态变化。
Environ Int. 2020 Sep;142:105862. doi: 10.1016/j.envint.2020.105862. Epub 2020 Jun 26.
7
Status and characteristics of ambient PM2.5 pollution in global megacities.全球特大城市环境 PM2.5 污染现状及特征。
Environ Int. 2016 Apr-May;89-90:212-21. doi: 10.1016/j.envint.2016.02.003. Epub 2016 Feb 15.
8
Spatio-temporal analysis of PM and policies in Northwestern South America.南美洲西北部颗粒物与政策的时空分析
Sci Total Environ. 2022 Dec 15;852:158504. doi: 10.1016/j.scitotenv.2022.158504. Epub 2022 Sep 6.
9
Spatial and Temporal Variation of Atmospheric Particulate Matter in Bangalore: A Technology-Intensive Region in India.班加罗尔大气颗粒物的时空变化:印度一个技术密集型地区。
Arch Environ Contam Toxicol. 2019 Aug;77(2):214-222. doi: 10.1007/s00244-019-00643-8. Epub 2019 Jun 5.
10
Spatio-temporal variability of particulate matter in the key part of Gansu Province, Western China.中国西部甘肃省关键区域颗粒物的时空变化特征
Environ Pollut. 2017 Nov;230:189-198. doi: 10.1016/j.envpol.2017.06.045. Epub 2017 Jun 23.

引用本文的文献

1
Rationale and methodology of a multicentric prospective cohort study on 'Longitudinal Effects of Air Pollution Exposure on Adolescent Lungs (APEAL)' in urban India: APEAL protocol.印度城市地区“空气污染暴露对青少年肺部的纵向影响(APEAL)”多中心前瞻性队列研究的原理与方法:APEAL方案
BMJ Open. 2025 Aug 12;15(8):e106329. doi: 10.1136/bmjopen-2025-106329.
2
Air quality indicators: when data disappear.空气质量指标:数据消失之时。
Bull World Health Organ. 2025 Jun 1;103(6):351-351A. doi: 10.2471/BLT.25.293937.
3
Impact of tree growth form on temporal and spatial patterns of particulate matter with various particle sizes in urban street canyons.

本文引用的文献

1
Source influence on emission pathways and ambient PM pollution over India (2015-2050).源对印度(2015 - 2050年)排放路径和环境颗粒物污染的影响。
Atmos Chem Phys. 2018 Jun;18(11):8017-8039. doi: 10.5194/acp-18-8017-2018. Epub 2018 Jun 7.
2
Real-time measurement and source apportionment of elements in Delhi's atmosphere.德里大气中元素的实时测量和来源解析。
Sci Total Environ. 2020 Nov 10;742:140332. doi: 10.1016/j.scitotenv.2020.140332. Epub 2020 Jun 23.
3
The MERRA-2 Aerosol Reanalysis, 1980 Onward. Part II: Evaluation and Case Studies.
树木生长形态对城市街道峡谷中不同粒径颗粒物时空分布格局的影响。
Landsc Ecol. 2025;40(1):5. doi: 10.1007/s10980-024-02023-7. Epub 2024 Dec 19.
4
Air pollution status and attributable health effects across the state of West Bengal, India, during 2016-2021.2016-2021 年印度西孟加拉邦的空气污染状况及归因于该状况的健康影响。
Environ Monit Assess. 2024 Jan 17;196(2):165. doi: 10.1007/s10661-024-12333-7.
5
Improving PM prediction in New Delhi using a hybrid extreme learning machine coupled with snake optimization algorithm.利用混合极限学习机和蛇型优化算法提高新德里的 PM 预测精度。
Sci Rep. 2023 Nov 29;13(1):21057. doi: 10.1038/s41598-023-47492-z.
6
Reversal of trends in global fine particulate matter air pollution.全球细颗粒物空气污染趋势逆转。
Nat Commun. 2023 Sep 2;14(1):5349. doi: 10.1038/s41467-023-41086-z.
7
Very high particulate pollution over northwest India captured by a high-density in situ sensor network.一个高密度原位传感器网络捕捉到印度西北部地区极高的颗粒物污染情况。
Sci Rep. 2023 Aug 14;13(1):13201. doi: 10.1038/s41598-023-39471-1.
8
Hesperidin Protects Human HaCaT Keratinocytes from Particulate Matter 2.5-Induced Apoptosis via the Inhibition of Oxidative Stress and Autophagy.橙皮苷通过抑制氧化应激和自噬保护人HaCaT角质形成细胞免受细颗粒物2.5诱导的凋亡。
Antioxidants (Basel). 2022 Jul 14;11(7):1363. doi: 10.3390/antiox11071363.
9
Impact of Circular, Waste-Heat Reuse Pathways on PM-Air Quality, CO Emissions, and Human Health in India: Comparison with Material Exchange Potential.循环、余热再利用途径对印度 PM 空气质量、CO 排放和人类健康的影响:与物质交换潜力的比较。
Environ Sci Technol. 2022 Jul 5;56(13):9773-9783. doi: 10.1021/acs.est.1c05897. Epub 2022 Jun 15.
10
Impact of COVID-19 Pandemic Lockdown in Ambient Concentrations of Aromatic Volatile Organic Compounds in a Metropolitan City of Western India.印度西部一座大都市中新冠疫情封锁对芳香族挥发性有机化合物环境浓度的影响。
J Geophys Res Atmos. 2022 Mar 27;127(6):e2022JD036628. doi: 10.1029/2022JD036628. Epub 2022 Mar 23.
MERRA-2气溶胶再分析,始于1980年。第二部分:评估与案例研究。
J Clim. 2017 Sep 1;30(17):6851-6872. doi: 10.1175/jcli-d-16-0613.1. Epub 2017 Jul 27.
4
Temporary reduction in fine particulate matter due to 'anthropogenic emissions switch-off' during COVID-19 lockdown in Indian cities.印度城市在新冠疫情封锁期间因“人为排放关停”导致细颗粒物暂时减少。
Sustain Cities Soc. 2020 Nov;62:102382. doi: 10.1016/j.scs.2020.102382. Epub 2020 Jul 13.
5
Diurnal and temporal changes in air pollution during COVID-19 strict lockdown over different regions of India.新冠疫情严格封控期间印度不同地区空气污染的日变化和时变化。
Environ Pollut. 2020 Nov;266(Pt 3):115368. doi: 10.1016/j.envpol.2020.115368. Epub 2020 Aug 13.
6
A high-resolution emission inventory of air pollutants from primary crop residue burning over Northern India based on VIIRS thermal anomalies.基于 VIIRS 热异常的印度北部主要农作物秸秆燃烧产生的空气污染物排放的高分辨率清单。
Environ Pollut. 2020 Nov;266(Pt 1):115132. doi: 10.1016/j.envpol.2020.115132. Epub 2020 Jul 3.
7
On the widespread enhancement in fine particulate matter across the Indo-Gangetic Plain towards winter.冬季印度-恒河平原地区细颗粒物广泛增加。
Sci Rep. 2020 Apr 3;10(1):5862. doi: 10.1038/s41598-020-62710-8.
8
Seasonal characteristics of aerosols (PM and PM) and their source apportionment using PMF: A four year study over Delhi, India.利用 PMF 研究印度德里地区气溶胶(PM 和 PM )的季节特征及其来源解析:一项为期四年的研究。
Environ Pollut. 2020 Jul;262:114337. doi: 10.1016/j.envpol.2020.114337. Epub 2020 Mar 10.
9
Short-Term Associations of Fine Particulate Matter and Synoptic Weather Types with Cardiovascular Mortality: An Ecological Time-Series Study in Shanghai, China.短期细颗粒物与天气形势对心血管死亡率的关联:中国上海的一项生态时间序列研究。
Int J Environ Res Public Health. 2020 Feb 10;17(3):1111. doi: 10.3390/ijerph17031111.
10
The Modern-Era Retrospective Analysis for Research and Applications, Version 2 (MERRA-2).现代时代研究与应用回顾分析第2版(MERRA-2)
J Clim. 2017 Jun 20;Volume 30(Iss 13):5419-5454. doi: 10.1175/JCLI-D-16-0758.1.