Nascimento Marcio Luis Ferreira
Nano Group @ UFBA, Department of Chemical Engineering, Polytechnic School, Federal University of Bahia, Rua Aristides Novis 2, Federação, 40210 - 630, Salvador, BA, Brazil.
PEI - Graduate Program in Industrial Engineering, Department of Chemical Engineering, Polytechnic School, Federal University of Bahia, Rua Aristides Novis 2, Federação, 40210 - 630, Salvador, BA, Brazil.
Infect Dis Model. 2020;5:670-680. doi: 10.1016/j.idm.2020.08.012. Epub 2020 Sep 6.
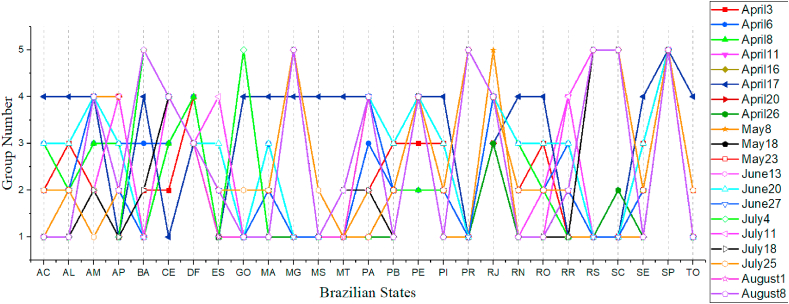
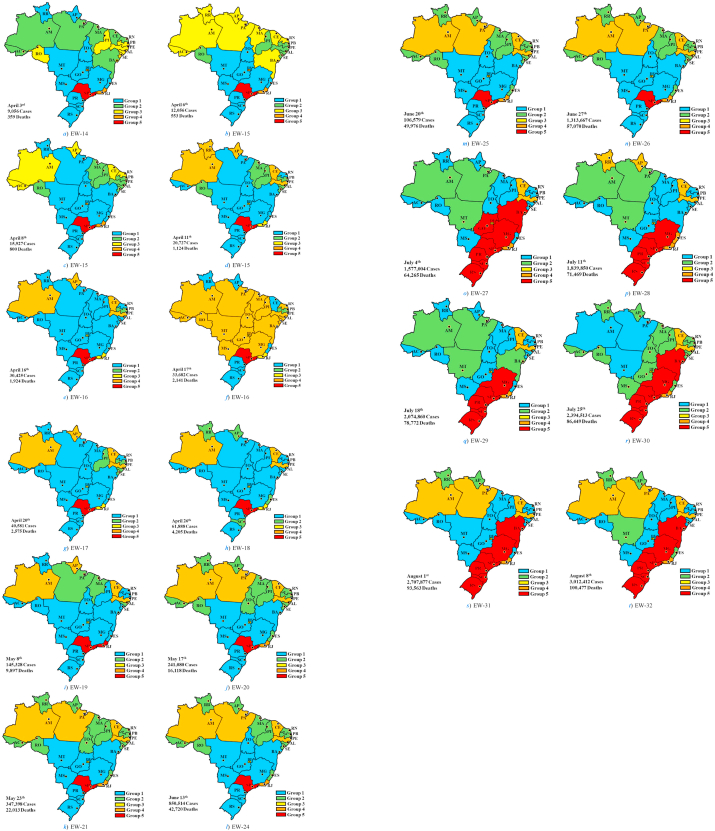
This data-driven work aims to analyze and classify the spatiotemporal distribution of all Brazilian states considering data so diverse as the number of Covid-19 cases, deaths, confirmed cases per 100 k inhabitants, mortality per 100 k inhabitants and case fatality rates as health indicators. We also considered population, area and population density as geographic indicators. Finally, GDP and HDI were taken into account as economic and social criteria. For this task data were collected from April 3rd until August 8th, 2020, corresponding to epidemiological weeks 14-32, reaching three million cases and a hundred thousand deaths. With this data it was possible to classify Brazilian states using multivariate methods into possible groups by means of non-hierarchical (-means) cluster as well as factor analysis. It was possible to group all states plus the Federal District into five clusters, taking into account these 10 variables over the first five months of the epidemic. Group changes between states were observed over time and clusters, and between three and four factors were found. However, even with great difference on health indicators during days, the number of clusters remains fixed. Also, São Paulo and Rio de Janeiro states were ranked at top list taking into account all epidemiological weeks. Correlations were observed between variables, such as the number of Covid cases and deaths with GDP for most of epidemiological weeks. Some clusters were more critical due to specific variables, including cities that are main hotspots. These multivariate findings would provide a comprehensive description of the ongoing Covid-19 epidemic and may help to guide subsequent studies to understand and control virus transmission.
这项数据驱动的工作旨在分析和分类巴西所有州的时空分布,所考虑的数据包括新冠疫情病例数、死亡数、每10万居民确诊病例数、每10万居民死亡率以及病死率等多种健康指标。我们还将人口、面积和人口密度作为地理指标。最后,将国内生产总值(GDP)和人类发展指数(HDI)作为经济和社会标准纳入考量。对于这项任务,数据收集时间为2020年4月3日至8月8日,对应第14 - 32个流行病学周,病例数达300万,死亡数达10万。利用这些数据,通过非层次聚类(K均值聚类)和因子分析等多元方法,可以将巴西各州划分为可能的组。考虑到疫情前五个月的这10个变量,有可能将所有州以及联邦区分为五个聚类。随着时间推移,观察到各州之间以及聚类之间的分组变化,并且发现了三到四个因子。然而,即使在不同日期健康指标差异很大的情况下,聚类数量仍保持不变。此外,考虑到所有流行病学周,圣保罗州和里约热内卢州排名靠前。在大多数流行病学周中,观察到变量之间的相关性,例如新冠病例数和死亡数与GDP之间的相关性。由于特定变量,包括作为主要热点地区的城市,一些聚类情况更为严峻。这些多元分析结果将全面描述正在发生的新冠疫情,并可能有助于指导后续研究以了解和控制病毒传播。