• 文献检索
  • 文档翻译
  • 深度研究
  • 学术资讯
  • Suppr Zotero 插件Zotero 插件
  • 邀请有礼
  • 套餐&价格
  • 历史记录
应用&插件
Suppr Zotero 插件Zotero 插件浏览器插件Mac 客户端Windows 客户端微信小程序
定价
高级版会员购买积分包购买API积分包
服务
文献检索文档翻译深度研究API 文档MCP 服务
关于我们
关于 Suppr公司介绍联系我们用户协议隐私条款
关注我们

Suppr 超能文献

核心技术专利:CN118964589B侵权必究
粤ICP备2023148730 号-1Suppr @ 2026

文献检索

告别复杂PubMed语法,用中文像聊天一样搜索,搜遍4000万医学文献。AI智能推荐,让科研检索更轻松。

立即免费搜索

文件翻译

保留排版,准确专业,支持PDF/Word/PPT等文件格式,支持 12+语言互译。

免费翻译文档

深度研究

AI帮你快速写综述,25分钟生成高质量综述,智能提取关键信息,辅助科研写作。

立即免费体验

混沌、渗流与新冠病毒传播:一个两步模型

Chaos, percolation and the coronavirus spread: a two-step model.

作者信息

Zheng Hua, Bonasera Aldo

机构信息

School of Physics and Information Technology, Shaanxi Normal University, Xi'an, 710119 China.

Cyclotron Institute, Texas A&M University, College Station, TX 77843 USA.

出版信息

Eur Phys J Plus. 2020;135(10):799. doi: 10.1140/epjp/s13360-020-00811-z. Epub 2020 Oct 9.

DOI:10.1140/epjp/s13360-020-00811-z
PMID:33052299
原文链接:https://pmc.ncbi.nlm.nih.gov/articles/PMC7544563/
Abstract

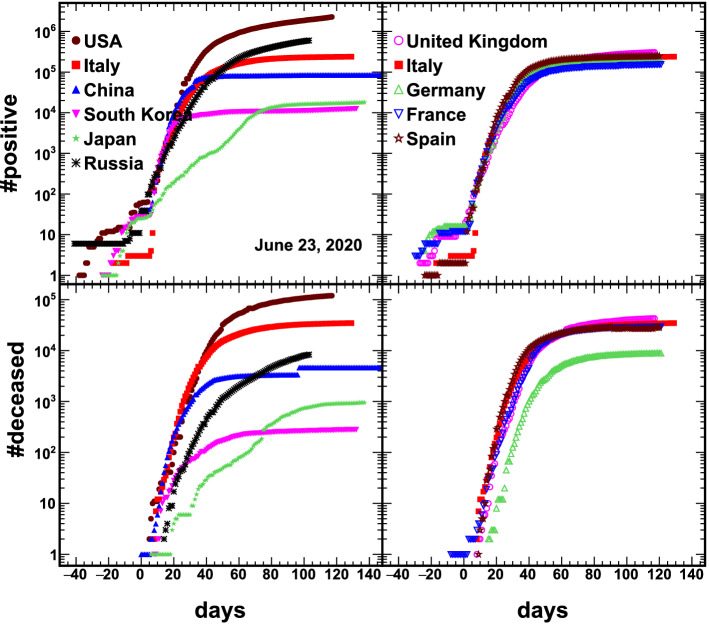
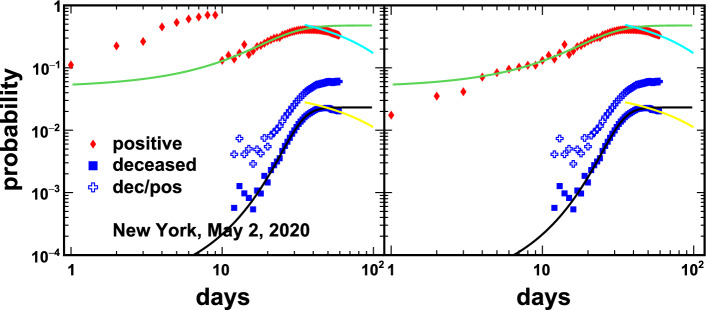
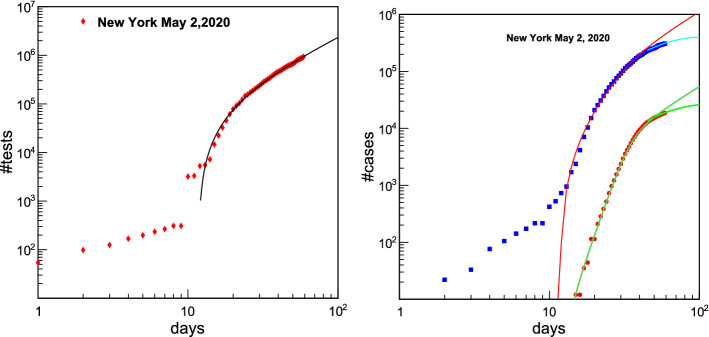
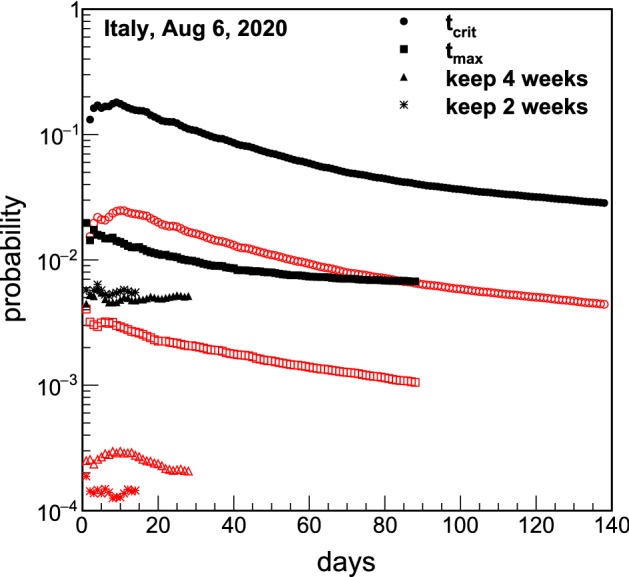
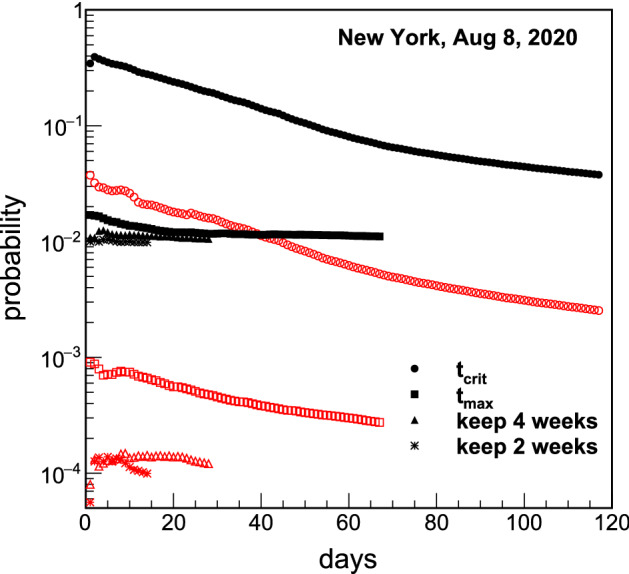
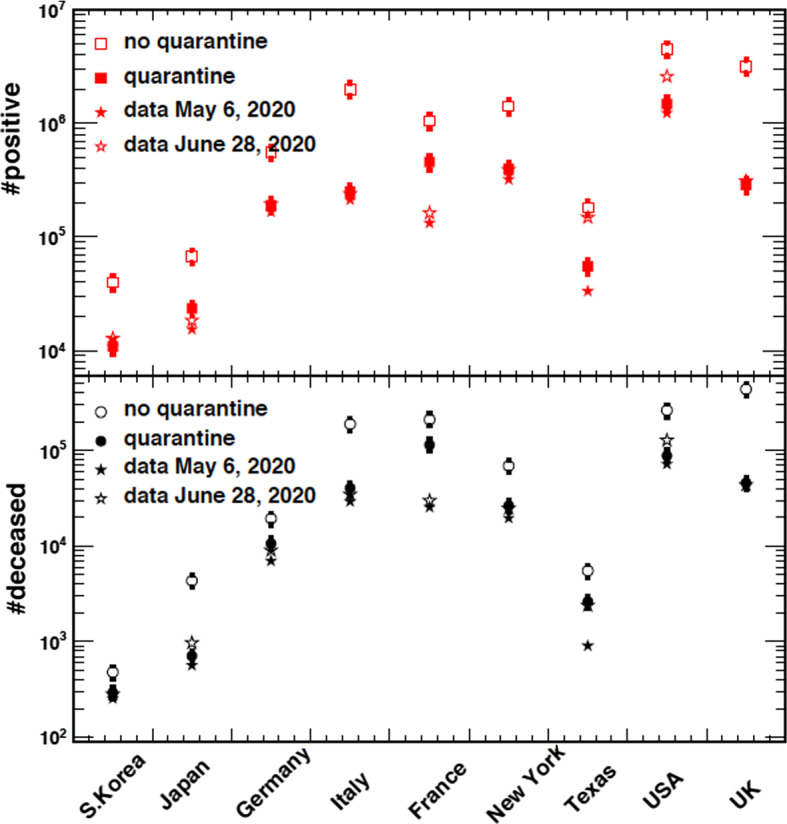
We discuss a two-step model for the rise and decay of a new coronavirus (Severe Acute Respiratory Syndrome-CoV-2) first reported in December 2019, COVID-19. The first stage is well described by the same equation for turbulent flows, population growth and chaotic maps: a small number of infected, , grows exponentially to a saturation value, . The typical growth time (aggressive spreading of the virus) is given by where is the Lyapunov exponent. After a time determined by social distancing and/or other measures, the spread decreases exponentially analogous to nuclear decays and non-chaotic maps. Some countries, like China, S. Korea and Italy, are in this second stage while others including the USA are near the end of the growth stage. The model predicted 15,000 (±2250) casualties for the Lombardy region (Italy) at the end of the spreading around May 10, 2020. Without the quarantine, the casualties would have been more than 50,000, one hundred days after the start of the pandemic. The data from the 50 US states are of very poor quality because of an extremely late and confused response to the pandemic, resulting unfortunately in a large number of casualties, more than 70,000 on May 6, 2020, and more than 170,000 on August 21, 2020. S. Korea, notwithstanding the high population density ( ) and the closeness to China, responded best to the pandemic with 255 deceased as of May 6, 2020, and 301 on August 21, 2020.

摘要

我们讨论了一种针对2019年12月首次报告的新型冠状病毒(严重急性呼吸综合征冠状病毒2,即COVID-19)的兴衰的两步模型。第一阶段可以用与湍流、人口增长和混沌映射相同的方程很好地描述:少量感染者(I)呈指数增长至饱和值(I_{max})。典型的增长时间(病毒的快速传播)由(t_{growth}=\frac{1}{\lambda}\ln\frac{I_{max}}{I_0})给出,其中(\lambda)是李雅普诺夫指数。在经过由社交距离和/或其他措施确定的时间(t_{suppression})后,传播类似于核衰变和非混沌映射那样呈指数下降。一些国家,如中国、韩国和意大利,处于第二阶段,而包括美国在内的其他国家接近增长阶段的末期。该模型预测,到2020年5月10日左右传播结束时,意大利伦巴第大区将有15000(±2250)人伤亡。如果没有隔离措施,在疫情开始一百天后,伤亡人数将超过50000人。由于对疫情的反应极其迟缓且混乱,美国50个州的数据质量非常差,不幸导致大量人员伤亡,2020年5月6日超过70000人,2020年8月21日超过170000人。韩国尽管人口密度高((51.8)人/平方公里)且与中国接壤,但对疫情的应对最好,截至2020年5月6日有255人死亡,2020年8月21日有301人死亡。

https://cdn.ncbi.nlm.nih.gov/pmc/blobs/8644/7544563/bfd9286835f2/13360_2020_811_Fig17_HTML.jpg
https://cdn.ncbi.nlm.nih.gov/pmc/blobs/8644/7544563/762a1b9c268f/13360_2020_811_Fig1_HTML.jpg
https://cdn.ncbi.nlm.nih.gov/pmc/blobs/8644/7544563/34187415a9e5/13360_2020_811_Fig2_HTML.jpg
https://cdn.ncbi.nlm.nih.gov/pmc/blobs/8644/7544563/1f1c3bef2659/13360_2020_811_Fig3_HTML.jpg
https://cdn.ncbi.nlm.nih.gov/pmc/blobs/8644/7544563/5004416db6c3/13360_2020_811_Fig4_HTML.jpg
https://cdn.ncbi.nlm.nih.gov/pmc/blobs/8644/7544563/58079ad00780/13360_2020_811_Fig5_HTML.jpg
https://cdn.ncbi.nlm.nih.gov/pmc/blobs/8644/7544563/97cb41abe9dd/13360_2020_811_Fig6_HTML.jpg
https://cdn.ncbi.nlm.nih.gov/pmc/blobs/8644/7544563/5bd4736145c7/13360_2020_811_Fig7_HTML.jpg
https://cdn.ncbi.nlm.nih.gov/pmc/blobs/8644/7544563/aa53545cfc7d/13360_2020_811_Fig8_HTML.jpg
https://cdn.ncbi.nlm.nih.gov/pmc/blobs/8644/7544563/1888191cd9c9/13360_2020_811_Fig9_HTML.jpg
https://cdn.ncbi.nlm.nih.gov/pmc/blobs/8644/7544563/2b72f6fafc92/13360_2020_811_Fig10_HTML.jpg
https://cdn.ncbi.nlm.nih.gov/pmc/blobs/8644/7544563/ea1bed144431/13360_2020_811_Fig11_HTML.jpg
https://cdn.ncbi.nlm.nih.gov/pmc/blobs/8644/7544563/529b6e6b8e7e/13360_2020_811_Fig12_HTML.jpg
https://cdn.ncbi.nlm.nih.gov/pmc/blobs/8644/7544563/f2d7bdd81ff5/13360_2020_811_Fig13_HTML.jpg
https://cdn.ncbi.nlm.nih.gov/pmc/blobs/8644/7544563/ccd81f908679/13360_2020_811_Fig14_HTML.jpg
https://cdn.ncbi.nlm.nih.gov/pmc/blobs/8644/7544563/eeab657d730d/13360_2020_811_Fig15_HTML.jpg
https://cdn.ncbi.nlm.nih.gov/pmc/blobs/8644/7544563/35e33a411338/13360_2020_811_Fig16_HTML.jpg
https://cdn.ncbi.nlm.nih.gov/pmc/blobs/8644/7544563/bfd9286835f2/13360_2020_811_Fig17_HTML.jpg

相似文献

1
Chaos, percolation and the coronavirus spread: a two-step model.混沌、渗流与新冠病毒传播:一个两步模型
Eur Phys J Plus. 2020;135(10):799. doi: 10.1140/epjp/s13360-020-00811-z. Epub 2020 Oct 9.
2
Effect of the social distancing measures on the spread of COVID-19 in 10 highly infected countries.社交距离措施对 10 个高感染国家 COVID-19 传播的影响。
Sci Total Environ. 2020 Nov 10;742:140430. doi: 10.1016/j.scitotenv.2020.140430. Epub 2020 Jun 22.
3
Travel-related control measures to contain the COVID-19 pandemic: a rapid review.旅行相关的控制措施以遏制 COVID-19 大流行:快速综述。
Cochrane Database Syst Rev. 2020 Oct 5;10:CD013717. doi: 10.1002/14651858.CD013717.
4
Measures implemented in the school setting to contain the COVID-19 pandemic.学校为控制 COVID-19 疫情而采取的措施。
Cochrane Database Syst Rev. 2022 Jan 17;1(1):CD015029. doi: 10.1002/14651858.CD015029.
5
A Simulation of a COVID-19 Epidemic Based on a Deterministic SEIR Model.基于确定性 SEIR 模型的 COVID-19 疫情模拟。
Front Public Health. 2020 May 28;8:230. doi: 10.3389/fpubh.2020.00230. eCollection 2020.
6
Tracing day-zero and forecasting the COVID-19 outbreak in Lombardy, Italy: A compartmental modelling and numerical optimization approach.追踪意大利伦巴第地区的零号病人并预测 COVID-19 疫情:一种房室模型和数值优化方法。
PLoS One. 2020 Oct 30;15(10):e0240649. doi: 10.1371/journal.pone.0240649. eCollection 2020.
7
An Improved Calculation Formula of the Extended Entropic Chaos Degree and Its Application to Two-Dimensional Chaotic Maps.扩展熵混沌度的一种改进计算公式及其在二维混沌映射中的应用
Entropy (Basel). 2021 Nov 14;23(11):1511. doi: 10.3390/e23111511.
8
First Wave of COVID-19 Pandemic in Italy: Data and Evidence.意大利的 COVID-19 大流行第一波:数据和证据。
Adv Exp Med Biol. 2021;1353:91-113. doi: 10.1007/978-3-030-85113-2_6.
9
Covid-19 Outbreak Progression in Italian Regions: Approaching the Peak by the End of March in Northern Italy and First Week of April in Southern Italy.意大利各地区的新冠疫情进展:北部地区将于 3 月底达到高峰,南部地区将于 4 月初达到高峰。
Int J Environ Res Public Health. 2020 Apr 27;17(9):3025. doi: 10.3390/ijerph17093025.
10
Assessment of the potential role of atmospheric particulate pollution and airborne transmission in intensifying the first wave pandemic impact of SARS-CoV-2/COVID-19 in Northern Italy.评估大气颗粒物污染和空气传播在加剧意大利北部SARS-CoV-2/COVID-19第一波大流行影响中的潜在作用。
Bull Atmos Sci Technol. 2020;1(3-4):515-550. doi: 10.1007/s42865-020-00024-3. Epub 2020 Dec 21.

引用本文的文献

1
Spectral study of COVID-19 pandemic in Japan: The dependence of spectral gradient on the population size of the community.日本新冠疫情的光谱研究:光谱梯度对社区人口规模的依赖性。
PLoS One. 2025 Jan 13;20(1):e0314233. doi: 10.1371/journal.pone.0314233. eCollection 2025.
2
Time series analysis of daily reported number of new positive cases of COVID-19 in Japan from January 2020 to February 2023.2020 年 1 月至 2023 年 2 月日本每日新增新冠肺炎确诊病例的时间序列分析。
PLoS One. 2023 Sep 15;18(9):e0285237. doi: 10.1371/journal.pone.0285237. eCollection 2023.
3
The Chaotic Behavior of the Spread of Infection during the COVID-19 Pandemic in Japan.

本文引用的文献

1
Early spread of COVID-19 in Romania: imported cases from Italy and human-to-human transmission networks.新型冠状病毒肺炎在罗马尼亚的早期传播:来自意大利的输入病例及人际传播网络
R Soc Open Sci. 2020 Jul 22;7(7):200780. doi: 10.1098/rsos.200780. eCollection 2020 Jul.
2
The coronavirus spread: the Italian case.新冠病毒传播:意大利的情况。
Eur Phys J Plus. 2020;135(6):453. doi: 10.1140/epjp/s13360-020-00494-6. Epub 2020 Jun 1.
3
Factors determining the diffusion of COVID-19 and suggested strategy to prevent future accelerated viral infectivity similar to COVID.
新冠疫情在日本期间感染传播的混沌行为。
Int J Environ Res Public Health. 2022 Oct 6;19(19):12804. doi: 10.3390/ijerph191912804.
4
General Commentary: Whether Urbanization Has Intensified the Spread of Infectious Diseases-Renewed Question by the COVID-19 Pandemic: Urban Density and COVID-19: Correlation Between Densification, Unhealthy Urban Conditions, and the Spread of Infectious Diseases.综述:城市化是否加剧了传染病的传播——新冠疫情引发的新问题:城市密度与新冠疫情:人口密集化、不健康的城市环境与传染病传播之间的关联
Front Public Health. 2022 Jul 13;10:917350. doi: 10.3389/fpubh.2022.917350. eCollection 2022.
5
Clustering and mapping the first COVID-19 outbreak in France.法国首例 COVID-19 疫情的聚类和映射。
BMC Public Health. 2022 Jul 1;22(1):1279. doi: 10.1186/s12889-022-13537-7.
6
The Chaotic Behavior of the Spread of Infection During the COVID-19 Pandemic in the United States and Globally.美国及全球新冠疫情期间感染传播的混沌行为
IEEE Access. 2021 Jun 2;9:80692-80702. doi: 10.1109/ACCESS.2021.3085240. eCollection 2021.
7
Estimating the Impact of Daily Weather on the Temporal Pattern of COVID-19 Outbreak in India.评估每日天气对印度新冠肺炎疫情时间模式的影响。
Earth Syst Environ. 2020;4(3):523-534. doi: 10.1007/s41748-020-00179-1. Epub 2020 Sep 17.
8
A note on Corona-virus (Covid-19) Infection in Italy.关于意大利新冠病毒(COVID-19)感染情况的说明。
Eur Phys J Plus. 2020;135(8):667. doi: 10.1140/epjp/s13360-020-00674-4. Epub 2020 Aug 18.
决定 COVID-19 传播的因素及预防未来类似 COVID 加速病毒传染性的建议策略
Sci Total Environ. 2020 Aug 10;729:138474. doi: 10.1016/j.scitotenv.2020.138474. Epub 2020 Apr 20.
4
Using social and behavioural science to support COVID-19 pandemic response.利用社会和行为科学来支持 COVID-19 大流行应对。
Nat Hum Behav. 2020 May;4(5):460-471. doi: 10.1038/s41562-020-0884-z. Epub 2020 Apr 30.
5
Laboratory diagnosis of emerging human coronavirus infections - the state of the art.新型人冠状病毒感染的实验室诊断——现状。
Emerg Microbes Infect. 2020 Dec;9(1):747-756. doi: 10.1080/22221751.2020.1745095.
6
SARS-CoV-2 Viral Load in Upper Respiratory Specimens of Infected Patients.感染患者上呼吸道标本中的新型冠状病毒2型病毒载量
N Engl J Med. 2020 Mar 19;382(12):1177-1179. doi: 10.1056/NEJMc2001737. Epub 2020 Feb 19.
7
Grail of RAS cancer drugs within reach.RAS癌症药物的圣杯触手可及。
Nat Biotechnol. 2020 Jan;38(1):6-8. doi: 10.1038/s41587-019-0382-x.
8
Saving Human Lives: What Complexity Science and Information Systems can Contribute.拯救人类生命:复杂性科学与信息系统能做出的贡献
J Stat Phys. 2015;158(3):735-781. doi: 10.1007/s10955-014-1024-9. Epub 2014 Jun 5.