Harvard T.H. Chan School of Public Health, Boston, Massachusetts, United States of America.
Francois-Xavier Bagnoud Center for Health and Human Rights, Harvard University, Boston, Massachusetts, United States of America.
PLoS Med. 2020 Oct 20;17(10):e1003402. doi: 10.1371/journal.pmed.1003402. eCollection 2020 Oct.
In the United States, non-Hispanic Black (NHB), Hispanic, and non-Hispanic American Indian/Alaska Native (NHAIAN) populations experience excess COVID-19 mortality, compared to the non-Hispanic White (NHW) population, but racial/ethnic differences in age at death are not known. The release of national COVID-19 death data by racial/ethnic group now permits analysis of age-specific mortality rates for these groups and the non-Hispanic Asian or Pacific Islander (NHAPI) population. Our objectives were to examine variation in age-specific COVID-19 mortality rates by racial/ethnicity and to calculate the impact of this mortality using years of potential life lost (YPLL).
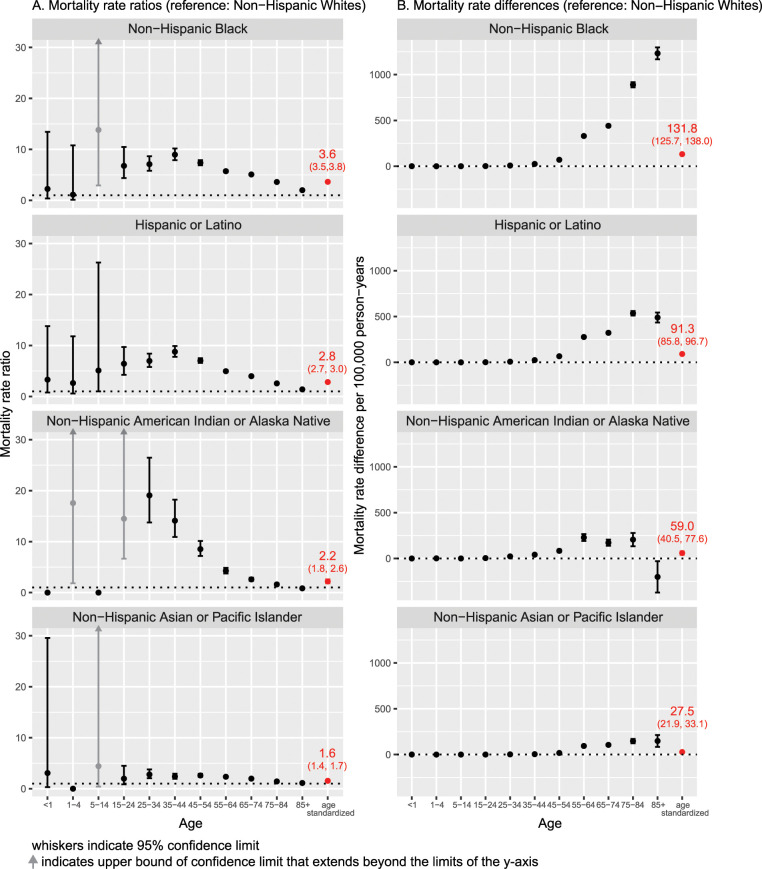
This cross-sectional study used the recently publicly available data on US COVID-19 deaths with reported race/ethnicity, for the time period February 1, 2020, to July 22, 2020. Population data were drawn from the US Census. As of July 22, 2020, the number of COVID-19 deaths equaled 68,377 for NHW, 29,476 for NHB, 23,256 for Hispanic, 1,143 for NHAIAN, and 6,468 for NHAPI populations; the corresponding population sizes were 186.4 million, 40.6 million, 2.6 million, 19.5 million, and 57.7 million. Age-standardized rate ratios relative to NHW were 3.6 (95% CI 3.5, 3.8; p < 0.001) for NHB, 2.8 (95% CI 2.7, 3.0; p < 0.001) for Hispanic, 2.2 (95% CI 1.8, 2.6; p < 0.001) for NHAIAN, and 1.6 (95% CI 1.4, 1.7; p < 0.001) for NHAP populations. By contrast, NHB rate ratios relative to NHW were 7.1 (95% CI 5.8, 8.7; p < 0.001) for persons aged 25-34 years, 9.0 (95% CI 7.9, 10.2; p < 0.001) for persons aged 35-44 years, and 7.4 (95% CI 6.9, 7.9; p < 0.001) for persons aged 45-54 years. Even at older ages, NHB rate ratios were between 2.0 and 5.7. Similarly, rate ratios for the Hispanic versus NHW population were 7.0 (95% CI 5.8, 8.7; p < 0.001), 8.8 (95% CI 7.8, 9.9; p < 0.001), and 7.0 (95% CI 6.6, 7.5; p < 0.001) for the corresponding age strata above, with remaining rate ratios ranging from 1.4 to 5.0. Rate ratios for NHAIAN were similarly high through age 74 years. Among NHAPI persons, rate ratios ranged from 2.0 to 2.8 for persons aged 25-74 years and were 1.6 and 1.2 for persons aged 75-84 and 85+ years, respectively. As a consequence, more YPLL before age 65 were experienced by the NHB and Hispanic populations than the NHW population-despite the fact that the NHW population is larger-with a ratio of 4.6:1 and 3.2:1, respectively, for NHB and Hispanic persons. Study limitations include likely lag time in receipt of completed death certificates received by the Centers for Disease Control and Prevention for transmission to NCHS, with consequent lag in capturing the total number of deaths compared to data reported on state dashboards.
In this study, we observed racial variation in age-specific mortality rates not fully captured with examination of age-standardized rates alone. These findings suggest the importance of examining age-specific mortality rates and underscores how age standardization can obscure extreme variations within age strata. To avoid overlooking such variation, data that permit age-specific analyses should be routinely publicly available.
在美国,与非西班牙裔白人(NHW)人群相比,非西班牙裔黑人(NHB)、西班牙裔和非西班牙裔美洲印第安人/阿拉斯加原住民(NHAIAN)人群的 COVID-19 死亡率更高,但目前尚不清楚这些人群在死亡年龄方面的差异。现在,美国按种族/族裔群体发布了 COVID-19 死亡数据,这使得我们可以分析这些群体和非西班牙裔亚裔或太平洋岛民(NHAPI)人群的特定年龄死亡率,并使用潜在寿命损失年(YPLL)来计算死亡率的影响。
本横断面研究使用了最近公开的美国 COVID-19 死亡数据,这些数据报告了种族/族裔信息,时间范围为 2020 年 2 月 1 日至 2020 年 7 月 22 日。人口数据来自美国人口普查。截至 2020 年 7 月 22 日,NHW 人群的 COVID-19 死亡人数为 68377 人,NHB 人群为 29476 人,西班牙裔人群为 23256 人,NHAIAN 人群为 1143 人,NHAPI 人群为 6468 人;相应的人口规模分别为 1.864 亿、4060 万、260 万、1950 万和 5770 万。与 NHW 相比,NHB 的年龄标准化率比值为 3.6(95%CI 3.5,3.8;p < 0.001),西班牙裔为 2.8(95%CI 2.7,3.0;p < 0.001),NHAIAN 为 2.2(95%CI 1.8,2.6;p < 0.001),NHAPI 为 1.6(95%CI 1.4,1.7;p < 0.001)。相比之下,NHB 人群与 NHW 相比,25-34 岁人群的年龄标准化率比值为 7.1(95%CI 5.8,8.7;p < 0.001),35-44 岁人群为 9.0(95%CI 7.9,10.2;p < 0.001),45-54 岁人群为 7.4(95%CI 6.9,7.9;p < 0.001)。即使在年龄较大的人群中,NHB 的年龄标准化率比值也在 2.0 到 5.7 之间。同样,与 NHW 相比,西班牙裔的年龄标准化率比值为 7.0(95%CI 5.8,8.7;p < 0.001),35-44 岁人群为 8.8(95%CI 7.8,9.9;p < 0.001),45-54 岁人群为 7.0(95%CI 6.6,7.5;p < 0.001),其余年龄标准化率比值在 1.4 到 5.0 之间。NHAIAN 的年龄标准化率比值也同样高达 74 岁。在 NHAPI 人群中,25-74 岁人群的年龄标准化率比值在 2.0 到 2.8 之间,75-84 岁和 85 岁以上人群的年龄标准化率比值分别为 1.6 和 1.2。因此,尽管 NHW 人群更大,但 NHB 和西班牙裔人群在 65 岁之前的 YPLL 比 NHW 人群多——NHB 人群的比值为 4.6:1,西班牙裔人群的比值为 3.2:1。研究的局限性包括疾病控制和预防中心收到的完整死亡证明可能存在滞后,导致与在州数据面板上报告的数据相比,总死亡人数的捕获存在滞后。
在这项研究中,我们观察到特定年龄死亡率存在种族差异,这无法仅通过检查年龄标准化率来完全捕捉。这些发现表明了检查特定年龄死亡率的重要性,并强调了年龄标准化如何掩盖年龄层次内的极端差异。为了避免忽略这种差异,应定期公开提供允许进行特定年龄分析的数据。