• 文献检索
  • 文档翻译
  • 深度研究
  • 学术资讯
  • Suppr Zotero 插件Zotero 插件
  • 邀请有礼
  • 套餐&价格
  • 历史记录
应用&插件
Suppr Zotero 插件Zotero 插件浏览器插件Mac 客户端Windows 客户端微信小程序
定价
高级版会员购买积分包购买API积分包
服务
文献检索文档翻译深度研究API 文档MCP 服务
关于我们
关于 Suppr公司介绍联系我们用户协议隐私条款
关注我们

Suppr 超能文献

核心技术专利:CN118964589B侵权必究
粤ICP备2023148730 号-1Suppr @ 2026

文献检索

告别复杂PubMed语法,用中文像聊天一样搜索,搜遍4000万医学文献。AI智能推荐,让科研检索更轻松。

立即免费搜索

文件翻译

保留排版,准确专业,支持PDF/Word/PPT等文件格式,支持 12+语言互译。

免费翻译文档

深度研究

AI帮你快速写综述,25分钟生成高质量综述,智能提取关键信息,辅助科研写作。

立即免费体验

墨西哥特大城市北部边缘地区新冠病毒病的预测及潜在空间明确传播情况

Prediction and Potential Spatially Explicit Spread of COVID-19 in Mexico's Megacity North Periphery.

作者信息

Hernández-Flores Maria de la Luz, Escobar-Sánchez Jair, Paredes-Zarco Jesús Eduardo, Franyuti Kelly Giorgio Alberto, Carranza-Ramírez Lamán

机构信息

Consejo Ejecutivo del Complejo Científico y Tecnológico Sincrotrón, Boulevard Ciudad del Conocimiento y la Cultura, Manzana 10 Lote 1, Col. Santa Catarina, San Miguel Tornacuxtla, San Agustín Tlaxiaca 42163, Mexico.

INABISA, Investigación Aplicada para el Bienestar Social y Ambiental, Rio Papagayo #10, Ampliación el Palmar, Pachuca 42088, Mexico.

出版信息

Healthcare (Basel). 2020 Nov 2;8(4):453. doi: 10.3390/healthcare8040453.

DOI:10.3390/healthcare8040453
PMID:33147698
原文链接:https://pmc.ncbi.nlm.nih.gov/articles/PMC7712471/
Abstract

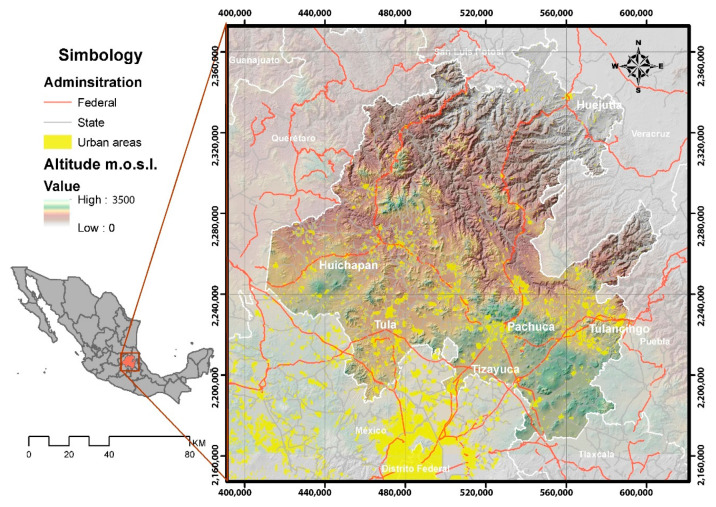
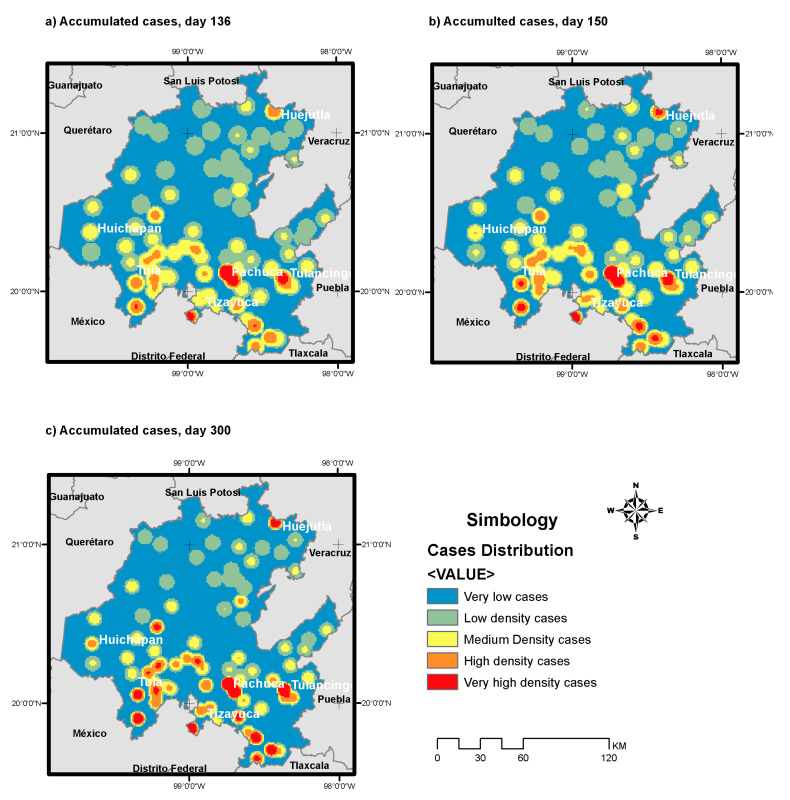
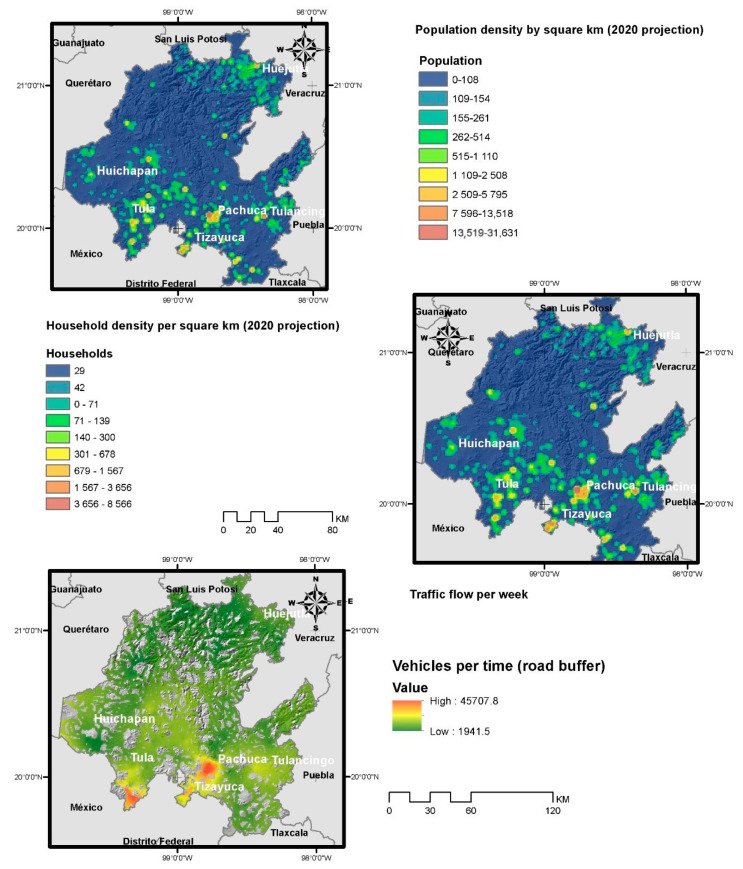
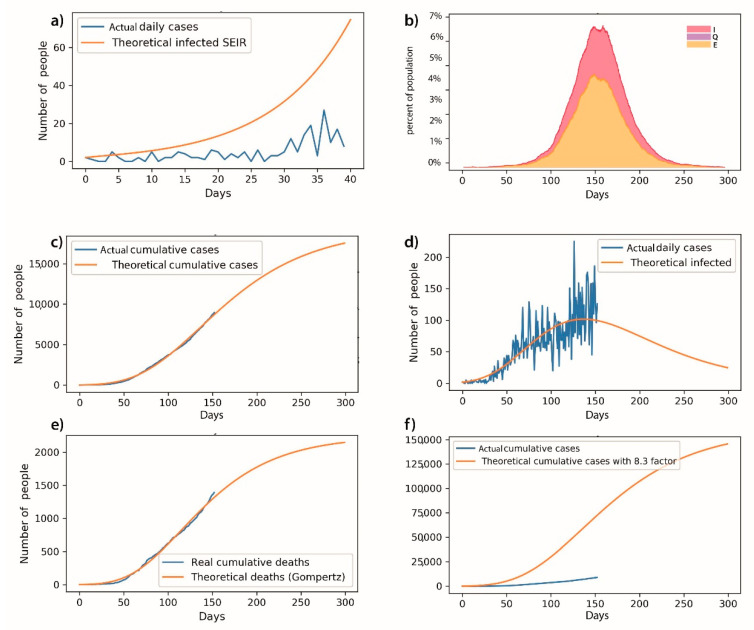
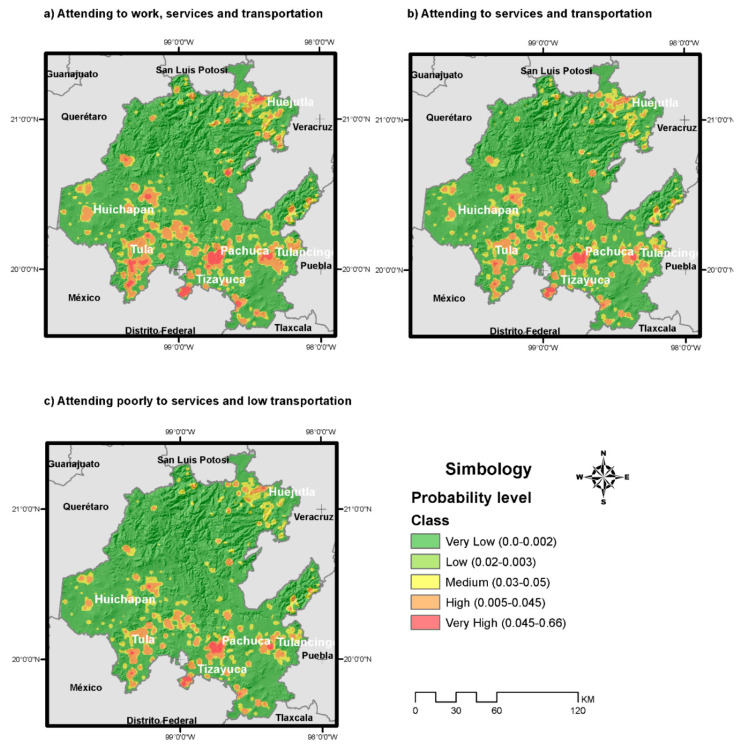
The novel COVID-19, detected in Wuhan, China, has reached almost every city across the globe, and researchers from many countries have used several epidemiologic models to describe the epidemic trends. In this context, it is also important to know the geographic extent of the infected population. Following this approach, a Gumpertz model was adapted with official data from the state of Hidalgo, Mexico, in order to estimate the people infected during this COVID-19 pandemic. We found, based on the adjusted data, the highest value in infected people according to official and theoretical data. Furthermore, using a geographical analysis based on geostatistical measures related to density of demographic and economic data, traffic level and geolocation, raster files were generated to estimate probability of coronavirus cases occurrence using the areas where the contagion may occur. We also distributed the maximum contagion obtained by the epidemic model, using these raster files, and a regression model to weight factors according their importance. Based on this estimated distribution, we found that most of the infected people were located in the southern border, a trend related to the economic strip in the southern part of Hidalgo State, associated with its vicinity to the Megacity of Mexico.

摘要

在中国武汉发现的新型冠状病毒肺炎已蔓延至全球几乎每一个城市,许多国家的研究人员运用多种流行病学模型来描述疫情趋势。在此背景下,了解感染人群的地理范围也很重要。按照这种方法,我们采用墨西哥伊达尔戈州的官方数据对冈珀茨模型进行了调整,以估算在此次新冠疫情期间的感染人数。基于调整后的数据,我们发现根据官方数据和理论数据得出的感染人数最高值。此外,利用基于与人口和经济数据密度、交通水平及地理位置相关的地统计量的地理分析,生成了栅格文件,以利用可能发生传染的区域估算新冠病例出现的概率。我们还利用这些栅格文件以及回归模型,根据各因素的重要性对其进行加权,来分布疫情模型得出的最大传染范围。基于这一估算分布,我们发现大多数感染者位于南部边境,这一趋势与伊达尔戈州南部的经济带有关,该经济带与其靠近墨西哥大城市有关。

https://cdn.ncbi.nlm.nih.gov/pmc/blobs/7a07/7712471/611d90f271b8/healthcare-08-00453-g005.jpg
https://cdn.ncbi.nlm.nih.gov/pmc/blobs/7a07/7712471/66f4a63e54fd/healthcare-08-00453-g001.jpg
https://cdn.ncbi.nlm.nih.gov/pmc/blobs/7a07/7712471/8d203a37e57c/healthcare-08-00453-g002.jpg
https://cdn.ncbi.nlm.nih.gov/pmc/blobs/7a07/7712471/ee216f13dca0/healthcare-08-00453-g003.jpg
https://cdn.ncbi.nlm.nih.gov/pmc/blobs/7a07/7712471/b55276d76e41/healthcare-08-00453-g004.jpg
https://cdn.ncbi.nlm.nih.gov/pmc/blobs/7a07/7712471/611d90f271b8/healthcare-08-00453-g005.jpg

相似文献

1
Prediction and Potential Spatially Explicit Spread of COVID-19 in Mexico's Megacity North Periphery.墨西哥特大城市北部边缘地区新冠病毒病的预测及潜在空间明确传播情况
Healthcare (Basel). 2020 Nov 2;8(4):453. doi: 10.3390/healthcare8040453.
2
Modeling and tracking Covid-19 cases using Big Data analytics on HPCC system platformm.在惠普高性能计算集群(HPCC)系统平台上使用大数据分析对新冠病毒疾病(Covid-19)病例进行建模和追踪。
J Big Data. 2021;8(1):33. doi: 10.1186/s40537-021-00423-z. Epub 2021 Feb 15.
3
Modeling the effect of area deprivation on COVID-19 incidences: a study of Chennai megacity, India.基于区域剥夺效应对 COVID-19 发病率的影响建模:印度钦奈特大城市研究。
Public Health. 2020 Aug;185:266-269. doi: 10.1016/j.puhe.2020.06.011. Epub 2020 Jun 12.
4
Covid-19 Outbreak Progression in Italian Regions: Approaching the Peak by the End of March in Northern Italy and First Week of April in Southern Italy.意大利各地区的新冠疫情进展:北部地区将于 3 月底达到高峰,南部地区将于 4 月初达到高峰。
Int J Environ Res Public Health. 2020 Apr 27;17(9):3025. doi: 10.3390/ijerph17093025.
5
Projected Impact of Mexico's Sugar-Sweetened Beverage Tax Policy on Diabetes and Cardiovascular Disease: A Modeling Study.墨西哥含糖饮料税政策对糖尿病和心血管疾病的预计影响:一项建模研究。
PLoS Med. 2016 Nov 1;13(11):e1002158. doi: 10.1371/journal.pmed.1002158. eCollection 2016 Nov.
6
Rapid establishment of a dedicated COVID-19 hospital in Mexico city during a public health crisis.在公共卫生危机期间,墨西哥城迅速建立了一家专门的 COVID-19 医院。
Hosp Pract (1995). 2022 Aug;50(3):183-187. doi: 10.1080/21548331.2021.2017644. Epub 2021 Dec 30.
7
The political and socioeconomic context of legal and illegal Mexican migration to the United States (1942-1984).墨西哥合法与非法移民美国的政治及社会经济背景(1942 - 1984年)
Int Migr. 1988 Mar;26(1):95-107. doi: 10.1111/j.1468-2435.1988.tb00613.x.
8
Uncertainty quantification in epidemiological models for the COVID-19 pandemic.新冠疫情流行病学模型中的不确定性量化。
Comput Biol Med. 2020 Oct;125:104011. doi: 10.1016/j.compbiomed.2020.104011. Epub 2020 Sep 25.
9
Modeling the trend of coronavirus disease 2019 and restoration of operational capability of metropolitan medical service in China: a machine learning and mathematical model-based analysis.基于机器学习和数学模型的分析:预测 2019 年冠状病毒病趋势及恢复中国大都市医疗服务运营能力。
Glob Health Res Policy. 2020 May 6;5:20. doi: 10.1186/s41256-020-00145-4. eCollection 2020.
10
SARS-CoV-2 infection fatality rate after the first epidemic wave in Mexico.墨西哥首轮疫情过后的 SARS-CoV-2 感染病死率。
Int J Epidemiol. 2022 May 9;51(2):429-439. doi: 10.1093/ije/dyac015.

引用本文的文献

1
Spatiotemporal patterns of the COVID-19 epidemic in Mexico at the municipality level.墨西哥市级层面新冠疫情的时空模式。
PeerJ. 2021 Dec 24;9:e12685. doi: 10.7717/peerj.12685. eCollection 2021.
2
Enhancing monitoring of rewilding progress through wildlife tracking and remote sensing.通过野生动物跟踪和遥感技术加强对再野化进程的监测。
PLoS One. 2021 Jul 9;16(7):e0253148. doi: 10.1371/journal.pone.0253148. eCollection 2021.

本文引用的文献

1
Socioeconomic and environmental patterns behind H1N1 spreading in Sweden.H1N1 在瑞典传播背后的社会经济和环境模式。
Sci Rep. 2021 Nov 18;11(1):22512. doi: 10.1038/s41598-021-01857-4.
2
Management strategies in a SEIR-type model of COVID 19 community spread.COVID-19 社区传播的 SEIR 型模型中的管理策略。
Sci Rep. 2020 Dec 4;10(1):21256. doi: 10.1038/s41598-020-77628-4.
3
Modeling and prediction of COVID-19 in Mexico applying mathematical and computational models.运用数学和计算模型对墨西哥的新冠疫情进行建模与预测。
Chaos Solitons Fractals. 2020 Sep;138:109946. doi: 10.1016/j.chaos.2020.109946. Epub 2020 May 29.
4
COVID-19 and urban vulnerability in India.COVID-19与印度城市的脆弱性
Habitat Int. 2020 Sep;103:102230. doi: 10.1016/j.habitatint.2020.102230. Epub 2020 Aug 18.
5
The spread of 2019-nCoV in China was primarily driven by population density. Comment on "Association between short-term exposure to air pollution and COVID-19 infection: Evidence from China" by Zhu et al.2019-nCoV 在我国的传播主要是由人口密度驱动的。评 Zhu 等人的“短期暴露于空气污染与 COVID-19 感染的关联:来自中国的证据”一文。
Sci Total Environ. 2020 Nov 20;744:141028. doi: 10.1016/j.scitotenv.2020.141028. Epub 2020 Jul 16.
6
Extended SIR Prediction of the Epidemics Trend of COVID-19 in Italy and Compared With Hunan, China.意大利新冠疫情趋势的扩展SIR预测及与中国湖南的比较。
Front Med (Lausanne). 2020 May 6;7:169. doi: 10.3389/fmed.2020.00169. eCollection 2020.
7
Population flow drives spatio-temporal distribution of COVID-19 in China.人口流动驱动中国 COVID-19 的时空分布。
Nature. 2020 Jun;582(7812):389-394. doi: 10.1038/s41586-020-2284-y. Epub 2020 Apr 29.
8
Spatial-temporal transmission of influenza and its health risks in an urbanized area.城市化地区流感的时空传播及其健康风险
Comput Environ Urban Syst. 2010 May;34(3):204-215. doi: 10.1016/j.compenvurbsys.2010.03.004. Epub 2010 Apr 7.
9
Modeling triple-diffusions of infectious diseases, information, and preventive behaviors through a metropolitan social network-An agent-based simulation.通过大都市社交网络对传染病、信息和预防行为的三重扩散进行建模——基于主体的模拟
Appl Geogr. 2014 Jun;50:31-39. doi: 10.1016/j.apgeog.2014.02.005. Epub 2014 Mar 4.
10
Rapid surveillance of COVID-19 in the United States using a prospective space-time scan statistic: Detecting and evaluating emerging clusters.使用前瞻性时空扫描统计方法对美国新冠病毒病进行快速监测:检测和评估新出现的聚集性疫情。
Appl Geogr. 2020 May;118:102202. doi: 10.1016/j.apgeog.2020.102202. Epub 2020 Apr 8.