• 文献检索
  • 文档翻译
  • 深度研究
  • 学术资讯
  • Suppr Zotero 插件Zotero 插件
  • 邀请有礼
  • 套餐&价格
  • 历史记录
应用&插件
Suppr Zotero 插件Zotero 插件浏览器插件Mac 客户端Windows 客户端微信小程序
定价
高级版会员购买积分包购买API积分包
服务
文献检索文档翻译深度研究API 文档MCP 服务
关于我们
关于 Suppr公司介绍联系我们用户协议隐私条款
关注我们

Suppr 超能文献

核心技术专利:CN118964589B侵权必究
粤ICP备2023148730 号-1Suppr @ 2026

文献检索

告别复杂PubMed语法,用中文像聊天一样搜索,搜遍4000万医学文献。AI智能推荐,让科研检索更轻松。

立即免费搜索

文件翻译

保留排版,准确专业,支持PDF/Word/PPT等文件格式,支持 12+语言互译。

免费翻译文档

深度研究

AI帮你快速写综述,25分钟生成高质量综述,智能提取关键信息,辅助科研写作。

立即免费体验

伊朗 COVID-19 发病率模式的时空分析。

Spatial and temporal analysis of the COVID-19 incidence pattern in Iran.

机构信息

Department of Natural Resources, Faculty of Agriculture and Natural Resources, Water Management Research Center, University of Mohaghegh Ardabili, Ardabil, Iran.

Department of Natural Resources, Faculty of Agriculture and Natural Resources, University of Mohaghegh Ardabili, Ardabili, Iran.

出版信息

Environ Sci Pollut Res Int. 2021 Mar;28(11):13605-13615. doi: 10.1007/s11356-020-11499-0. Epub 2020 Nov 14.

DOI:10.1007/s11356-020-11499-0
PMID:33188632
原文链接:https://pmc.ncbi.nlm.nih.gov/articles/PMC7666576/
Abstract

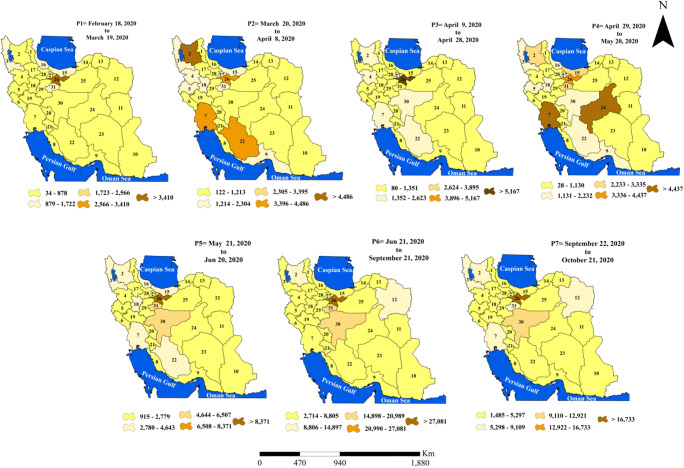
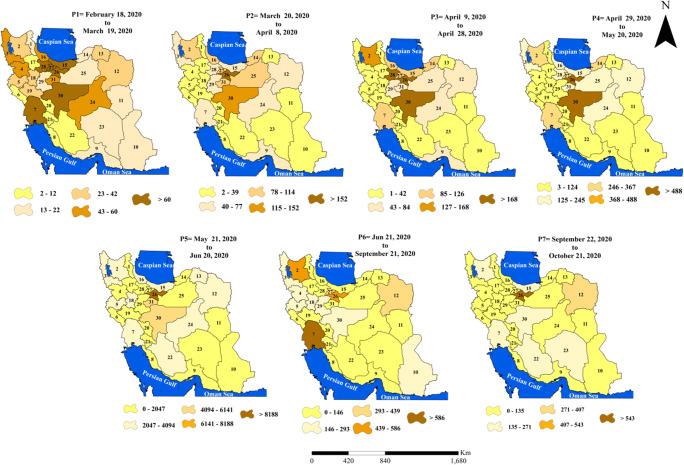
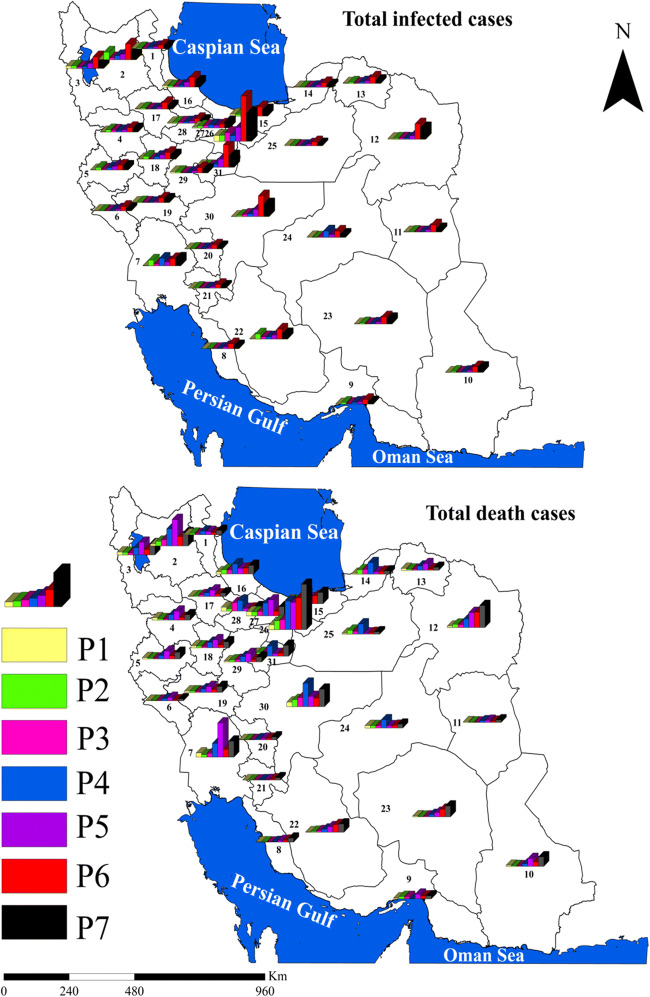
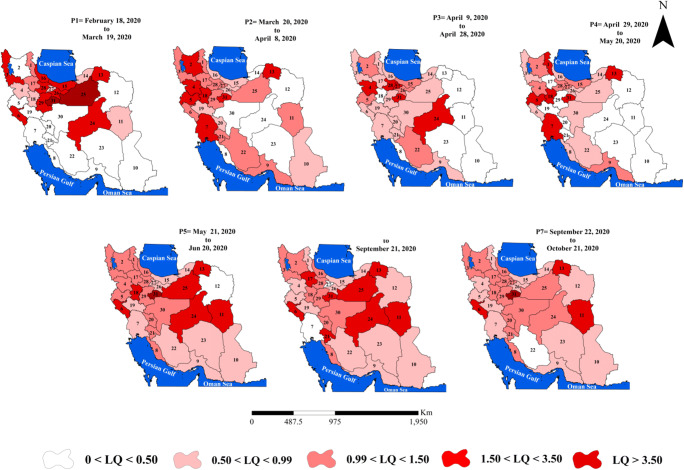
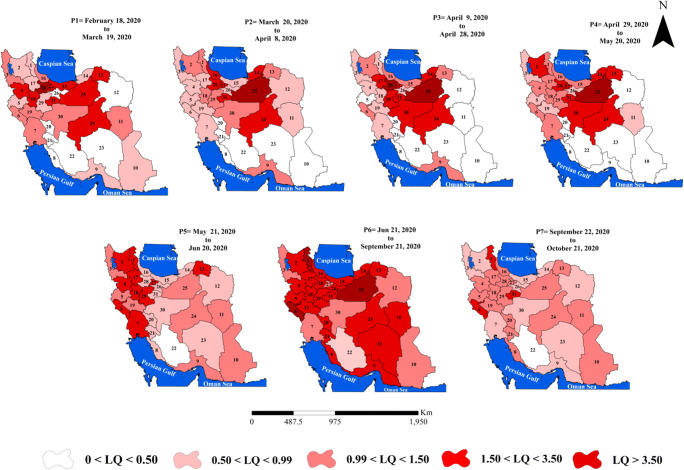
In the present paper, province-level variations of novel coronavirus (COVID-19) disease incidence across Iran were investigated. To this end, a geo-database from infected cases, deaths, total population, death-to-population ratio, and infected case-to-death ratio for 31 provinces of Iran and during seven successive periods of February 18-March 19 (P1), March 20-April 8 (P2), April 9-April 28 (P3), April 29-May 20 (P4), May 21-June 20 (P5), June 21-September 21 (P6), and September 22-October 21 (P7) of 2020 was built. Based on the last reports of the population and housing census (2018), Iran is home to 81.8 million people. Nationwide case series of 536,181 and 29,403 infected cases and deaths respectively with COVID-19 were reported to Iran's Minister of Health from February 18 to October 21, 2020. Of the infected cases, 5.48% have died. The spatiotemporal patterns of COVID-19 were different throughout the 31 study provinces. Firstly, the central, north, and northwest of Iran were the main hosts of this virus. Shortly after, other parts of Iran, most notably the west and southwest regions, experienced a momentous rise in the numeral of infected cases and deaths. In the first study period, Tehran, West Azerbaijan, Mazandaran, Qom, and Gilan had the most infected cases (> 1000). In the second to fourth periods, the number of provinces with higher than 1000 infected cases, respectively, reached 12, 10, and 17. For the last three periods (P5-P7), 31 provinces were assigned higher than 1000 infected cases. Tehran had the most deaths with an increasing trend for all study periods among other provinces. The areas around Kohgiluyeh and Boyer-Ahmad, Bushehr, Chaharmahal and Bakhtiari, South Khorasan, and Ilam had the least death cases. The numbers of infected (death) cases in Iran for the first to seventh periods (P1-P7) respectively were 16,730 (1208), 41,285 (1595), 28,530 (1876), 16,366 (1856), 80,694 (6588), 201,585 (6232), and 128,336 (6953). The location quotient (LQ) index showed that most provinces of Iran have the LQ > 1 indicating a high degree of COVID-19 concentration in most of the province's area in comparison with the nation, especially in the last study period (P7).

摘要

在本研究中,调查了伊朗各省新型冠状病毒(COVID-19)疾病发病率的省级差异。为此,构建了一个从 2020 年 2 月 18 日至 3 月 19 日(第 1 期)、3 月 20 日至 4 月 8 日(第 2 期)、4 月 9 日至 4 月 28 日(第 3 期)、4 月 29 日至 5 月 20 日(第 4 期)、5 月 21 日至 6 月 20 日(第 5 期)、6 月 21 日至 9 月 21 日(第 6 期)和 9 月 22 日至 10 月 21 日(第 7 期)共七个连续时期的感染病例、死亡人数、总人口、死亡人口比和感染病例死亡率的地理数据库。根据 2018 年人口和住房普查的最后报告,伊朗有 8180 万人。从 2020 年 2 月 18 日至 10 月 21 日,伊朗卫生部报告了全国 536181 例和 29403 例分别有 COVID-19 感染病例和死亡病例。在感染病例中,有 5.48%的人死亡。COVID-19 的时空模式在 31 个研究省份各不相同。首先,伊朗的中部、北部和西北部是该病毒的主要宿主。不久之后,伊朗的其他地区,尤其是西部和西南部地区,感染病例和死亡人数急剧上升。在第 1 期,德黑兰、东阿塞拜疆、马赞德兰、库姆和吉兰省的感染病例最多(>1000)。在第 2 至第 4 期,分别有 12、10 和 17 个省份的感染病例超过 1000 例。在最后三个时期(第 5 期至第 7 期),31 个省份的感染病例均超过 1000 例。德黑兰的死亡人数最多,其他省份的所有研究期间都呈上升趋势。科吉卢耶赫和博耶尔-阿哈迈德、布什尔、恰哈马哈尔和巴赫蒂亚里、南呼罗珊和伊拉姆地区的死亡病例最少。伊朗在第 1 至第 7 期(P1-P7)的感染(死亡)病例数分别为 16730(1208)、41285(1595)、28530(1876)、16366(1856)、80694(6588)、201585(6232)和 128336(6953)。洛特卡指数(LQ)指数显示,伊朗大多数省份的 LQ>1,这表明与全国相比,伊朗大部分地区的 COVID-19 浓度较高,尤其是在最后一个研究期(第 7 期)。

https://cdn.ncbi.nlm.nih.gov/pmc/blobs/5c38/7666576/c899a0c07cbc/11356_2020_11499_Fig6_HTML.jpg
https://cdn.ncbi.nlm.nih.gov/pmc/blobs/5c38/7666576/40b500fb691c/11356_2020_11499_Fig1_HTML.jpg
https://cdn.ncbi.nlm.nih.gov/pmc/blobs/5c38/7666576/aa08a18d4e0f/11356_2020_11499_Fig2_HTML.jpg
https://cdn.ncbi.nlm.nih.gov/pmc/blobs/5c38/7666576/cf551f0c75ef/11356_2020_11499_Fig3_HTML.jpg
https://cdn.ncbi.nlm.nih.gov/pmc/blobs/5c38/7666576/a3854fdb5198/11356_2020_11499_Fig4_HTML.jpg
https://cdn.ncbi.nlm.nih.gov/pmc/blobs/5c38/7666576/01902d268158/11356_2020_11499_Fig5_HTML.jpg
https://cdn.ncbi.nlm.nih.gov/pmc/blobs/5c38/7666576/c899a0c07cbc/11356_2020_11499_Fig6_HTML.jpg

相似文献

1
Spatial and temporal analysis of the COVID-19 incidence pattern in Iran.伊朗 COVID-19 发病率模式的时空分析。
Environ Sci Pollut Res Int. 2021 Mar;28(11):13605-13615. doi: 10.1007/s11356-020-11499-0. Epub 2020 Nov 14.
2
Spatial modeling, risk mapping, change detection, and outbreak trend analysis of coronavirus (COVID-19) in Iran (days between February 19 and June 14, 2020).伊朗2020年2月19日至6月14日期间冠状病毒(COVID-19)的空间建模、风险制图、变化检测及疫情趋势分析
Int J Infect Dis. 2020 Sep;98:90-108. doi: 10.1016/j.ijid.2020.06.058. Epub 2020 Jun 20.
3
Trend of hepatocellular carcinoma incidence after Bayesian correction for misclassified data in Iranian provinces.伊朗各省对错误分类数据进行贝叶斯校正后肝细胞癌发病率的趋势。
World J Hepatol. 2017 May 28;9(15):704-710. doi: 10.4254/wjh.v9.i15.704.
4
Integration of Moran's I, geographically weighted regression (GWR), and ordinary least square (OLS) models in spatiotemporal modeling of COVID-19 outbreak in Qom and Mazandaran Provinces, Iran.莫兰指数(Moran's I)、地理加权回归(GWR)和普通最小二乘法(OLS)模型在伊朗库姆省和马赞德兰省新冠肺炎疫情时空建模中的整合
Model Earth Syst Environ. 2023 Feb 15:1-15. doi: 10.1007/s40808-023-01729-y.
5
Bayesian adjustment for over-estimation and under-estimation of gastric cancer incidence across Iranian provinces.对伊朗各省份胃癌发病率高估和低估情况的贝叶斯调整。
World J Gastrointest Oncol. 2017 Feb 15;9(2):87-93. doi: 10.4251/wjgo.v9.i2.87.
6
Epidemic size, trend and spatiotemporal mapping of SARS-CoV-2 using geographical information system in Alborz Province, Iran.利用地理信息系统研究伊朗阿尔博兹省 SARS-CoV-2 的疫情规模、趋势和时空分布。
BMC Infect Dis. 2021 Nov 25;21(1):1185. doi: 10.1186/s12879-021-06870-6.
7
National spatiotemporal patterns of influenza-like illness in Iran: A pre-COVID-19 study (2015-2019).伊朗流感样疾病的全国时空模式:一项新冠疫情前的研究(2015 - 2019年)
PLoS One. 2025 Apr 21;20(4):e0320990. doi: 10.1371/journal.pone.0320990. eCollection 2025.
8
Joint Spatio-Temporal Shared Component Model with an Application in Iran Cancer Data.具有时空共享成分的联合模型及其在伊朗癌症数据中的应用
Asian Pac J Cancer Prev. 2018 Jun 25;19(6):1553-1560. doi: 10.22034/APJCP.2018.19.6.1553.
9
Bioclimatic Analysis and Spatial Distribution of Livestock Fascioliasis in Iran.伊朗家畜片形吸虫病的生物气候分析与空间分布
Iran J Parasitol. 2019 Jan-Mar;14(1):41-51.
10
Identification of high-risk and low-risk clusters and estimation of the relative risk of acute lymphoblastic leukemia in provinces of Iran during 2006-2014 period: A geo-epidemiological study.2006 - 2014年期间伊朗各省急性淋巴细胞白血病高风险和低风险集群的识别及相对风险估计:一项地理流行病学研究。
J Res Med Sci. 2021 Feb 27;26:18. doi: 10.4103/jrms.JRMS_662_20. eCollection 2021.

引用本文的文献

1
Detecting the Seasonal and Spatial Patterns of COVID-19 Hospitalization and Deaths in Iran: Insights from a Spatiotemporal and Hotspot Analysis.检测伊朗新冠肺炎住院和死亡的季节性及空间模式:时空与热点分析的见解
Int J Prev Med. 2025 Apr 24;16:20. doi: 10.4103/ijpvm.ijpvm_146_24. eCollection 2025.
2
Spatial analysis of COVID-19 incidence and mortality rates in northwest iran for future epidemic preparedness.伊朗西北部COVID-19发病率和死亡率的空间分析,以做好未来疫情防范准备。
Sci Rep. 2025 Mar 3;15(1):7450. doi: 10.1038/s41598-025-91246-y.
3
Occupational safety and health of nurses during the COVID-19 pandemic, the missing part of quality care: a qualitative study.

本文引用的文献

1
Spatial analysis of COVID-19 spread in Iran: Insights into geographical and structural transmission determinants at a province level.伊朗 COVID-19 传播的空间分析:省级层面地理和结构传播决定因素的见解。
PLoS Negl Trop Dis. 2020 Nov 18;14(11):e0008875. doi: 10.1371/journal.pntd.0008875. eCollection 2020 Nov.
2
Effects of temperature variation and humidity on the death of COVID-19 in Wuhan, China.温度变化和湿度对中国武汉 COVID-19 死亡的影响。
Sci Total Environ. 2020 Jul 1;724:138226. doi: 10.1016/j.scitotenv.2020.138226. Epub 2020 Mar 26.
3
Investigation of effective climatology parameters on COVID-19 outbreak in Iran.
护士在 COVID-19 大流行期间的职业安全与健康:缺失的优质护理环节:一项定性研究。
BMJ Open. 2024 Jun 10;14(6):e083863. doi: 10.1136/bmjopen-2024-083863.
4
Patterns of case fatality and hospitalization duration among nearly 1 million hospitalized COVID-19 patients covered by Iran Health Insurance Organization (IHIO) over two years of pandemic: An analysis of associated factors.在大流行的两年中,伊朗健康保险组织(IHIO)覆盖的近 100 万例住院 COVID-19 患者的病死率和住院时间模式:相关因素分析。
PLoS One. 2024 Feb 23;19(2):e0298604. doi: 10.1371/journal.pone.0298604. eCollection 2024.
5
Spatio-temporal dynamics and distributional trend analysis of African swine fever outbreaks (2020-2021) in North-East India.东北印度 2020-2021 年非洲猪瘟疫情的时空动态及分布趋势分析。
Trop Anim Health Prod. 2024 Jan 11;56(1):39. doi: 10.1007/s11250-023-03883-y.
6
An analysis of the spatio-temporal behavior of COVID-19 patients using activity trajectory data.利用活动轨迹数据对新冠肺炎患者的时空行为进行分析。
Heliyon. 2023 Oct 9;9(10):e20681. doi: 10.1016/j.heliyon.2023.e20681. eCollection 2023 Oct.
7
Cost-benefit analysis of Intensive Care Unit with Activity-Based Costing approach in the era COVID-19 pandemic: A case study from Iran.COVID-19 大流行时代采用作业成本法对重症监护病房的成本效益分析:来自伊朗的案例研究。
PLoS One. 2023 May 16;18(5):e0285792. doi: 10.1371/journal.pone.0285792. eCollection 2023.
8
The COVID-19 Mortality Rate Is Associated with Illiteracy, Age, and Air Pollution in Urban Neighborhoods: A Spatiotemporal Cross-Sectional Analysis.新冠病毒疾病死亡率与城市社区的文盲率、年龄及空气污染相关:一项时空横断面分析
Trop Med Infect Dis. 2023 Jan 26;8(2):85. doi: 10.3390/tropicalmed8020085.
9
Spatial-temporal trends of COVID-19 infection and mortality in Sudan.苏丹 COVID-19 感染和死亡的时空趋势。
Sci Rep. 2022 Oct 7;12(1):16822. doi: 10.1038/s41598-022-21137-z.
10
Effects of Vaccination and the Spatio-Temporal Diffusion of Covid-19 Incidence in Turkey.疫苗接种的影响以及土耳其新冠病毒感染率的时空扩散
Geogr Anal. 2022 Jun 4. doi: 10.1111/gean.12335.
调查伊朗 COVID-19 疫情的有效气候学参数。
Sci Total Environ. 2020 Aug 10;729:138705. doi: 10.1016/j.scitotenv.2020.138705. Epub 2020 Apr 17.
4
GIS-based spatial modeling of COVID-19 incidence rate in the continental United States.基于 GIS 的美国大陆 COVID-19 发病率空间建模。
Sci Total Environ. 2020 Aug 1;728:138884. doi: 10.1016/j.scitotenv.2020.138884. Epub 2020 Apr 22.
5
Predicting the mortality due to Covid-19 by the next month for Italy, Iran and South Korea; a simulation study.预测意大利、伊朗和韩国下个月因新冠疫情导致的死亡率;一项模拟研究。
Gastroenterol Hepatol Bed Bench. 2020 Spring;13(2):177-179.
6
Modified SEIR and AI prediction of the epidemics trend of COVID-19 in China under public health interventions.公共卫生干预下中国新冠疫情趋势的改进型SEIR模型及人工智能预测
J Thorac Dis. 2020 Mar;12(3):165-174. doi: 10.21037/jtd.2020.02.64.
7
Spatial-temporal distribution of COVID-19 in China and its prediction: A data-driven modeling analysis.中国新冠肺炎疫情的时空分布及其预测:基于数据驱动的建模分析
J Infect Dev Ctries. 2020 Mar 31;14(3):246-253. doi: 10.3855/jidc.12585.
8
Mapping the incidence of the COVID-19 hotspot in Iran - Implications for Travellers.绘制伊朗新冠疫情热点地区的发病率——对旅行者的影响。
Travel Med Infect Dis. 2020 Mar-Apr;34:101630. doi: 10.1016/j.tmaid.2020.101630. Epub 2020 Mar 14.
9
Distribution of the COVID-19 epidemic and correlation with population emigration from Wuhan, China.新冠疫情的分布与中国武汉人口外流的相关性。
Chin Med J (Engl). 2020 May 5;133(9):1044-1050. doi: 10.1097/CM9.0000000000000782.
10
[The epidemiological characteristics of an outbreak of 2019 novel coronavirus diseases (COVID-19) in China].[中国2019新型冠状病毒病(COVID-19)疫情的流行病学特征]
Zhonghua Liu Xing Bing Xue Za Zhi. 2020 Feb 10;41(2):145-151. doi: 10.3760/cma.j.issn.0254-6450.2020.02.003.