Department of Psychometrics and Statistics, University of Groningen, Grote Kruisstraat 2/1, 9712 TS, Groningen, The Netherlands.
Department of Psychiatry, University Centre Psychiatry, UMCG, Groningen, The Netherlands.
Qual Life Res. 2021 Nov;30(11):3179-3188. doi: 10.1007/s11136-020-02701-4. Epub 2020 Nov 22.
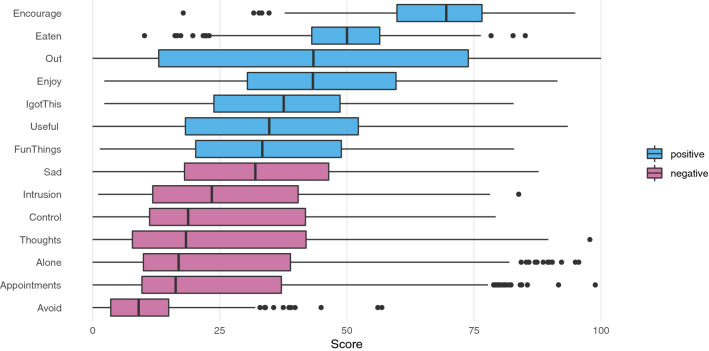
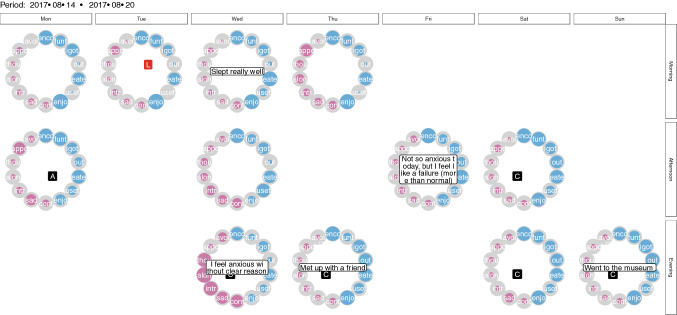
The experience sampling method (ESM) is used for intensive longitudinal time-series data collection during normal daily life. ESM data give information on momentary affect, activities and (social) context of, for example, patients suffering from mental disorders, and allows for person-specific feedback reports. However, current personalized feedback reports only display a selection of measured variables, and typically involve only summary statistics, thus not reflecting the dynamic fluctuations in affect and its influencing factors. To address this shortcoming, we developed a tool for dynamically visualizing ESM data.
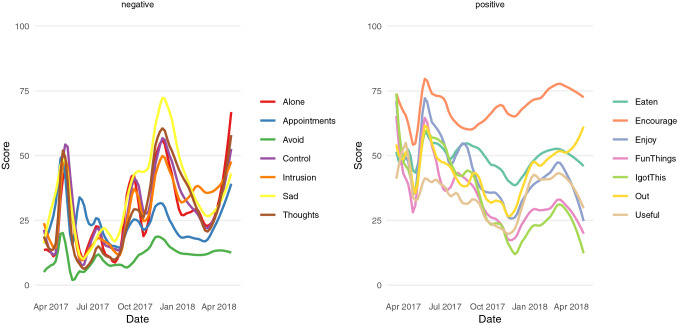
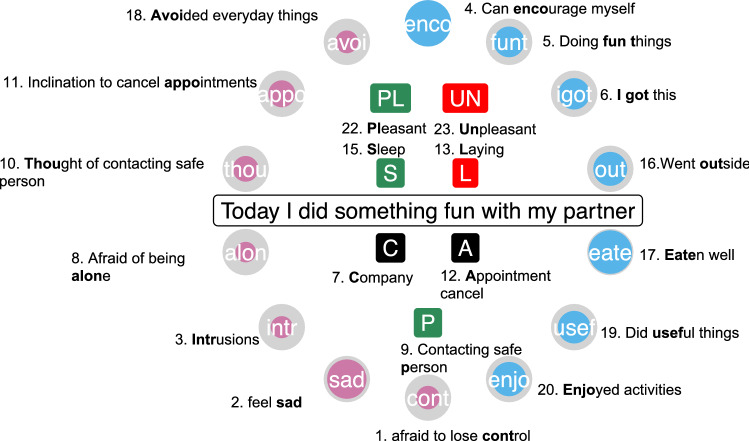
We introduce a new framework, ESMvis, for giving descriptive feedback, focusing on direct visualization of the dynamic nature of raw data. In this ESM feedback approach, raw ESM data are visualized using R software. We applied ESMvis to data collected for over 52 weeks on a patient diagnosed with an obsessive-compulsive disorder with comorbid depression.
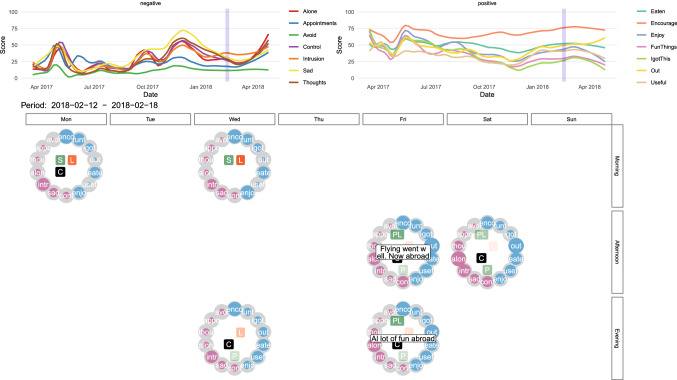
We provided personalized feedback, in which both the overall trajectory and specific time moments were captured in a movie format. Two relapses during the study period could be visually determined, and subsequently confirmed by the therapist. The therapist and patient evaluated ESMvis as an insightful add-on tool to care-as-usual.
ESMvis is a showcase on providing personalized feedback by dynamic visualization of ESM time-series data. Our tool is freely available and adjustable, making it widely applicable. In addition to potential applications in clinical practice, ESMvis can work as an exploratory tool that can lead to new hypotheses and inform more complex statistical techniques.
经验采样法(ESM)用于在正常日常生活中进行密集的纵向时间序列数据收集。ESM 数据提供了有关瞬间情感、活动和(社会)背景的信息,例如患有精神障碍的患者,并且允许进行特定于个人的反馈报告。然而,目前的个性化反馈报告仅显示了测量变量的选择,并且通常只涉及汇总统计信息,因此不能反映情感及其影响因素的动态波动。为了解决这个缺点,我们开发了一种用于动态可视化 ESM 数据的工具。
我们引入了一种新的框架 ESMvis,用于提供描述性反馈,重点是直接可视化原始数据的动态性质。在这种 ESM 反馈方法中,使用 R 软件可视化原始 ESM 数据。我们将 ESMvis 应用于一位被诊断患有伴有抑郁的强迫症患者的超过 52 周的数据收集。
我们提供了个性化反馈,其中以电影格式捕获了整体轨迹和特定时间点。在研究期间可以直观地确定两次复发,随后由治疗师确认。治疗师和患者将 ESMvis 评估为常规护理的有见地的附加工具。
ESMvis 是通过动态可视化 ESM 时间序列数据提供个性化反馈的一个范例。我们的工具是免费提供的,并且可调整,因此具有广泛的适用性。除了在临床实践中的潜在应用外,ESMvis 还可以作为一种探索性工具,可产生新的假设并为更复杂的统计技术提供信息。