Department of Epidemiology and Data Science, Amsterdam Public Health Research Institute, Amsterdam UMC, Vrije Universiteit Amsterdam, de Boelelaan 1089A, 1081 BT, Amsterdam, The Netherlands.
Upstream Team, Amsterdam UMC, VU University Amsterdam, De Boelelaan 1089a, Amsterdam, The Netherlands.
Eur J Nutr. 2021 Aug;60(5):2567-2580. doi: 10.1007/s00394-020-02436-5. Epub 2020 Nov 24.
To describe the patterns of ultra-processed foods (UPFs) consumption in the Netherlands; to test if exposure to the food environment is associated with UPFs consumption; and if this association differed across educational levels and neighbourhood urbanisation.
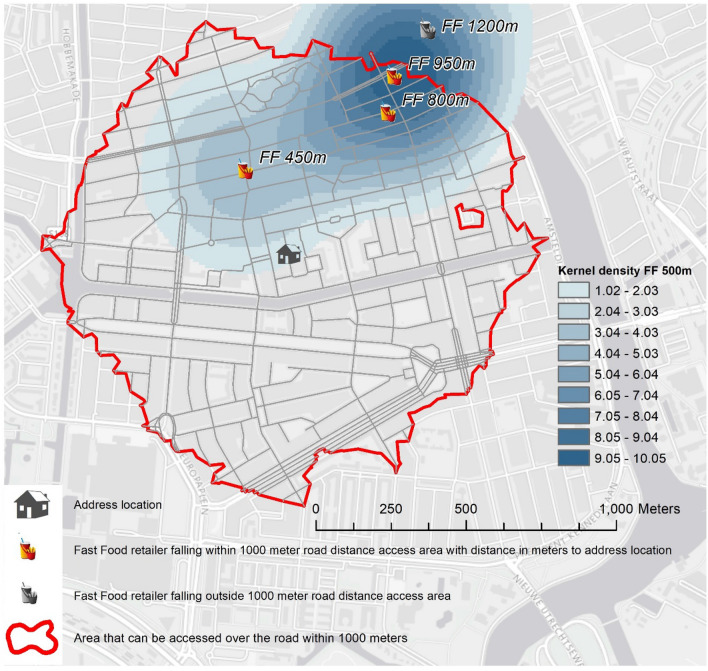
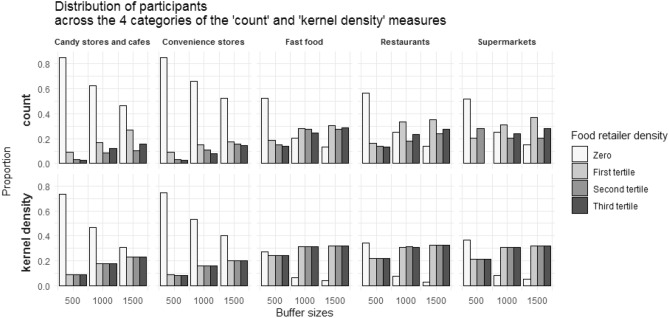
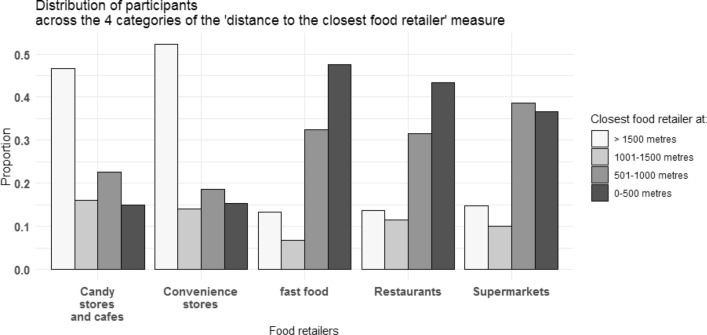
Cross-sectional study using 2015-data of 8104 older adults from the Dutch EPIC cohort. Proportion of UPFs consumption was calculated from a validated food-frequency questionnaire. Exposure to the food environment was defined as proximity and availability of supermarkets, fast-food restaurants, full-service restaurants, convenience stores, candy stores and cafés. Consumption of UPFs was expressed as both percentage of total grams and total kilocalories.
The study population was aged 70(± 10 SD) years and 80.5% was female. Average UPFs consumption was 17.8% of total food intake in grams and 37% of total energy intake. Those who consumed greater amounts of UPFs had a poorer overall diet quality. Adjusted linear regression models showed that closer proximity and larger availability to any type of food retailer was associated with lower UPFs consumption (both in grams and kilocalories). Somewhat stronger significant associations were found for proximity to restaurants (β = - 1.6%, 95% confidence interval (CI) = - 2.6; - 0.6), and supermarkets (β = - 2.2%, 95%CI = - 3.3; - 1.1); i.e., Individuals living within 500 m from the closest supermarket, as compared to 1500 m, had 2.6% less calories from UPFs. No differences were found on analyses stratified for urbanisation and education.
Using various measures of exposure to the food environment, we found that exposure to restaurants and supermarkets was associated with somewhat lower consumption of UPFs.
描述荷兰超加工食品(UPF)的消费模式;检验食品环境暴露与 UPF 消费之间的关系;以及这种关系是否因教育水平和社区城市化程度的不同而有所差异。
这是一项横断面研究,使用了荷兰 EPIC 队列 2015 年的 8104 名老年人的数据。从一份经过验证的食物频率问卷中计算出 UPF 消费的比例。食品环境暴露的定义是超市、快餐店、全套服务餐厅、便利店、糖果店和咖啡馆的临近程度和供应情况。UPF 的消费既表示为总克数的百分比,也表示为总千卡数的百分比。
研究人群的年龄为 70(±10 标准差)岁,80.5%为女性。平均 UPF 摄入量占总食物摄入量的 17.8%,占总能量摄入量的 37%。那些摄入更多 UPF 的人整体饮食质量较差。调整后的线性回归模型显示,任何类型的食品零售商的临近程度和供应情况越大,UPF 的消费就越低(以克和千卡为单位)。对于接近餐馆(β=-1.6%,95%置信区间[CI]:-2.6;-0.6)和超市(β=-2.2%,95%CI:-3.3;-1.1),这种关联更为显著;即与距离最近的超市 1500 米相比,居住在距离超市 500 米以内的人,其 UPF 中的卡路里摄入量减少了 2.6%。在按城市化和教育程度分层的分析中没有发现差异。
使用食品环境暴露的各种测量方法,我们发现,暴露于餐馆和超市与 UPF 消费的降低有一定的关联。