Carpenter Charlie M, Frank Daniel N, Williamson Kayla, Arbet Jaron, Wagner Brandie D, Kechris Katerina, Kroehl Miranda E
Department of Biostatistics and Informatics, Colorado School of Public Health, University of Colorado Anschutz Medical Campus, Aurora, CO, USA.
Division of Infectious Diseases, Department of Medicine, University of Colorado Anschutz Medical Campus, Denver, CO, USA.
BMC Bioinformatics. 2021 Feb 1;22(1):41. doi: 10.1186/s12859-021-03967-2.
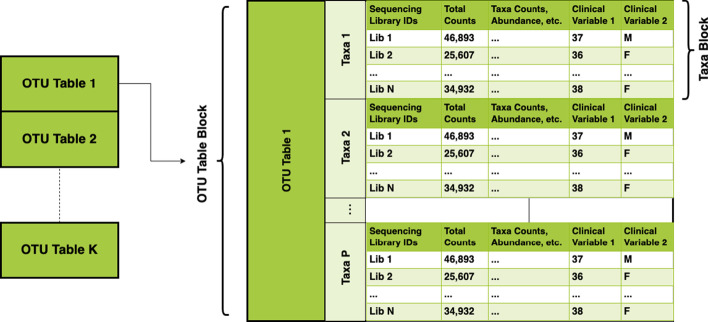
The drive to understand how microbial communities interact with their environments has inspired innovations across many fields. The data generated from sequence-based analyses of microbial communities typically are of high dimensionality and can involve multiple data tables consisting of taxonomic or functional gene/pathway counts. Merging multiple high dimensional tables with study-related metadata can be challenging. Existing microbiome pipelines available in R have created their own data structures to manage this problem. However, these data structures may be unfamiliar to analysts new to microbiome data or R and do not allow for deviations from internal workflows. Existing analysis tools also focus primarily on community-level analyses and exploratory visualizations, as opposed to analyses of individual taxa.
We developed the R package "tidyMicro" to serve as a more complete microbiome analysis pipeline. This open source software provides all of the essential tools available in other popular packages (e.g., management of sequence count tables, standard exploratory visualizations, and diversity inference tools) supplemented with multiple options for regression modelling (e.g., negative binomial, beta binomial, and/or rank based testing) and novel visualizations to improve interpretability (e.g., Rocky Mountain plots, longitudinal ordination plots). This comprehensive pipeline for microbiome analysis also maintains data structures familiar to R users to improve analysts' control over workflow. A complete vignette is provided to aid new users in analysis workflow.
tidyMicro provides a reliable alternative to popular microbiome analysis packages in R. We provide standard tools as well as novel extensions on standard analyses to improve interpretability results while maintaining object malleability to encourage open source collaboration. The simple examples and full workflow from the package are reproducible and applicable to external data sets.
了解微生物群落如何与环境相互作用的需求激发了多个领域的创新。基于序列分析产生的微生物群落数据通常具有高维度性,可能涉及由分类或功能基因/通路计数组成的多个数据表。将多个高维表与研究相关的元数据合并可能具有挑战性。R语言中现有的微生物组分析流程创建了自己的数据结构来管理这个问题。然而,这些数据结构对于微生物组数据或R语言的新手分析师来说可能并不熟悉,并且不允许偏离内部工作流程。现有的分析工具也主要侧重于群落水平的分析和探索性可视化,而不是单个分类单元的分析。
我们开发了R包“tidyMicro”,作为一个更完整的微生物组分析流程。这个开源软件提供了其他流行包中所有的基本工具(例如,序列计数表的管理、标准的探索性可视化和多样性推断工具),并补充了多种回归建模选项(例如,负二项式、贝塔二项式和/或基于秩的检验)以及新颖的可视化方法以提高可解释性(例如,落基山图、纵向排序图)。这个全面的微生物组分析流程还维护了R用户熟悉的数据结构,以增强分析师对工作流程的控制。提供了一个完整的示例来帮助新用户进行分析工作流程。
tidyMicro为R语言中流行的微生物组分析包提供了一个可靠的替代方案。我们提供了标准工具以及对标准分析的新颖扩展,以改善解释性结果,同时保持对象的可塑性以鼓励开源协作。该包中的简单示例和完整工作流程是可重复的,并且适用于外部数据集。