Toro A Richard, Catalán Francisco, Urdanivia Francesco R, Rojas Jhojan P, Manzano Carlos A, Seguel Rodrigo, Gallardo Laura, Osses Mauricio, Pantoja Nicolás, Leiva-Guzman Manuel A
Department of Chemistry, Faculty of Sciences, University of Chile, Santiago, Chile.
National Service of Meteorology and Hydrology, Lima, Peru.
Urban Clim. 2021 Mar;36:100803. doi: 10.1016/j.uclim.2021.100803. Epub 2021 Feb 13.
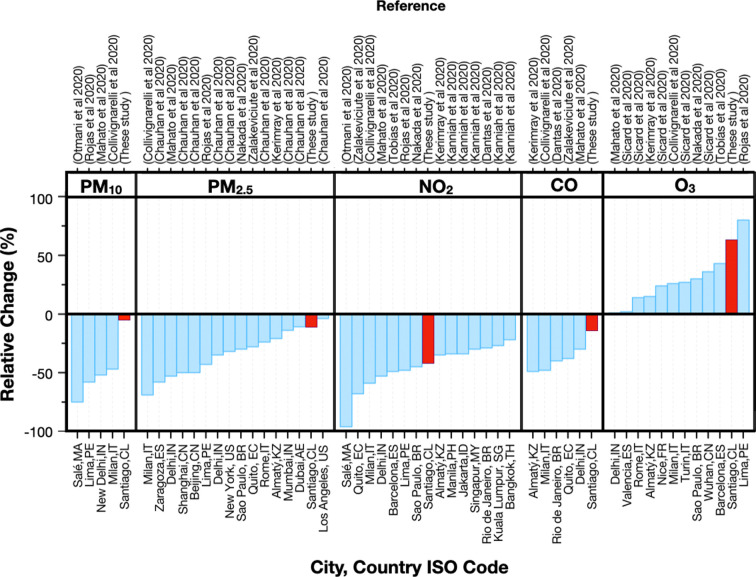
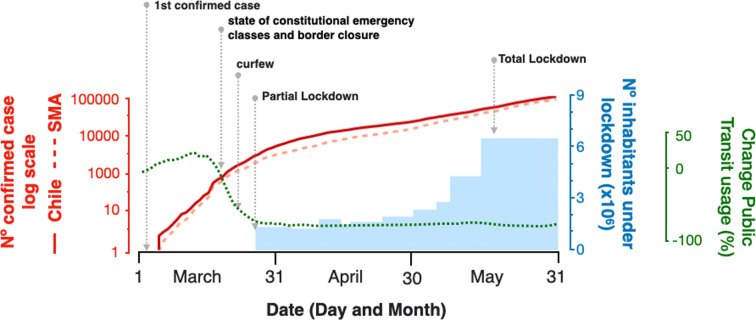
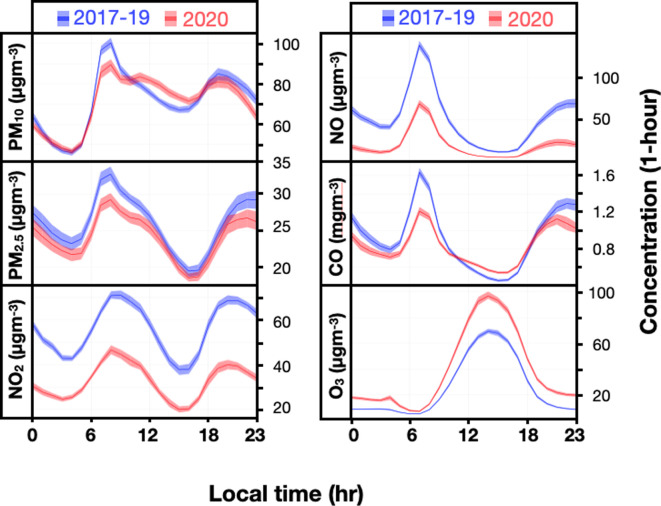
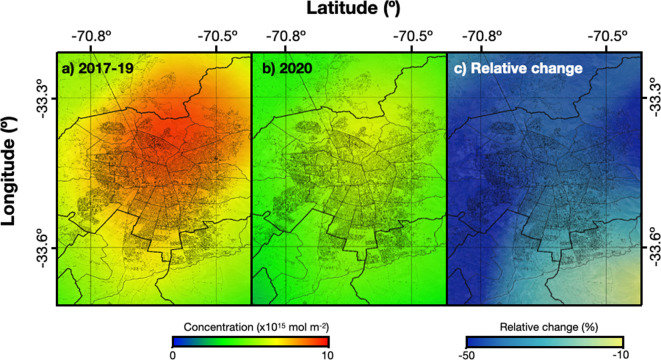
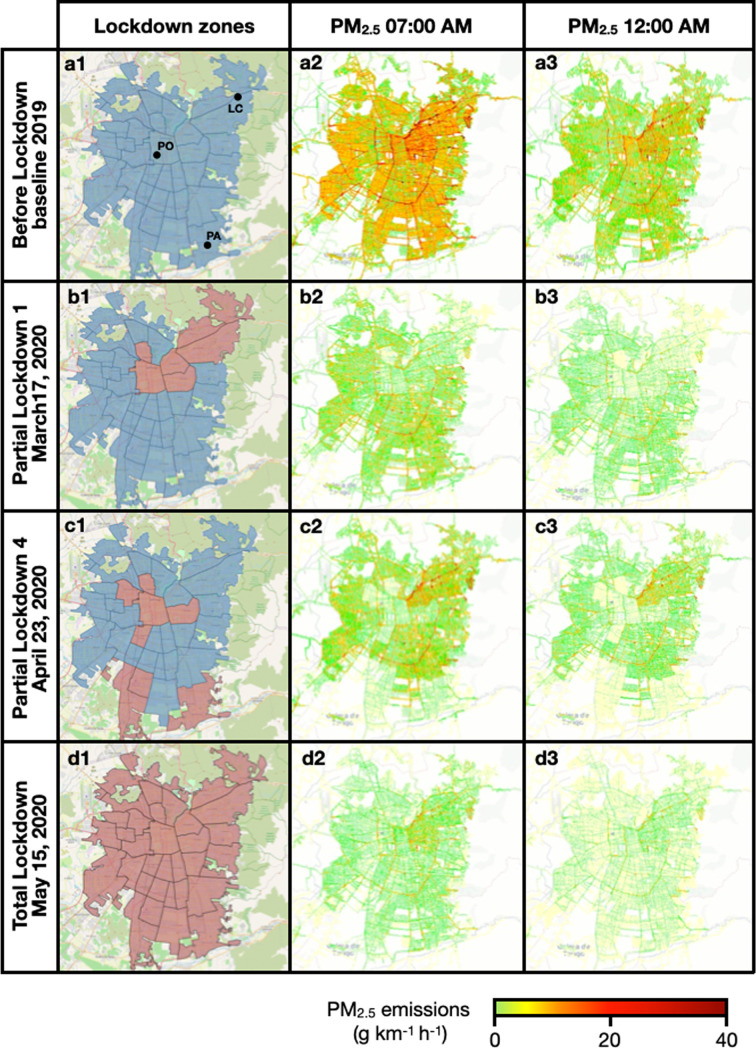
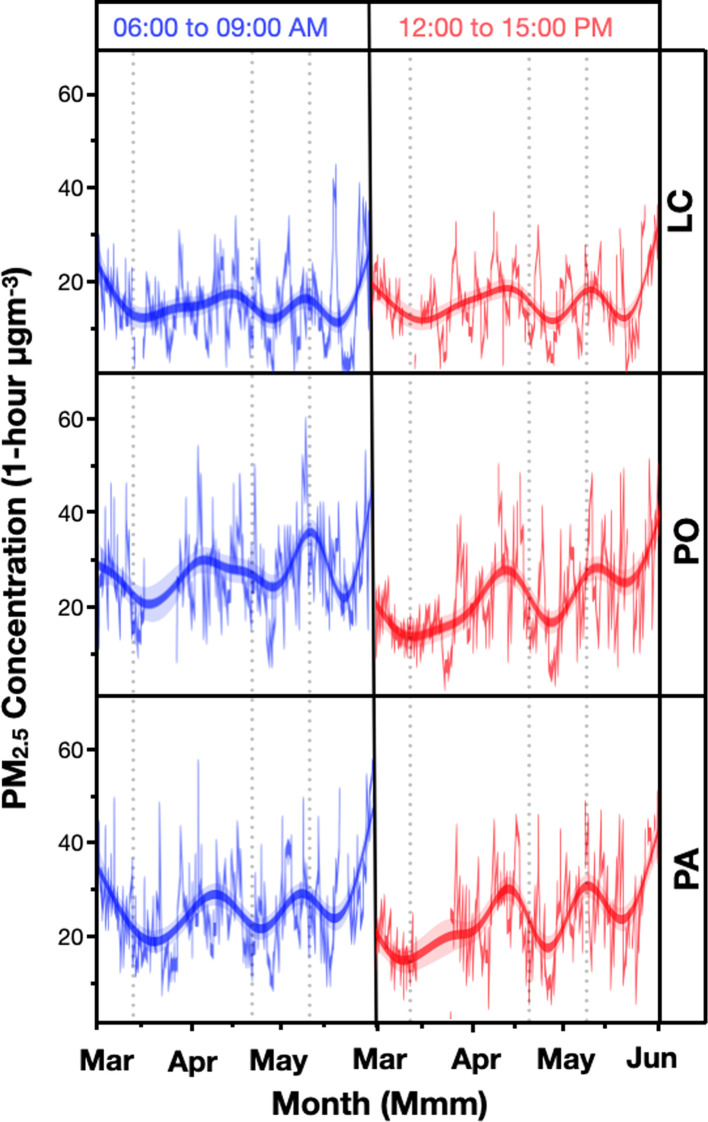
The implementation of confinement and physical distancing measures to restrict people's activities and transit in the midst of the COVID-19 pandemic allowed us to study how these measures affect the air quality in urban areas with high pollution rates, such as Santiago, Chile. A comparative study between the concentrations of PM10, PM2.5, NOx, CO, and O3 during the months of March to May 2020 and the corresponding concentrations during the same period in 2017-2019 is presented. A combination of surface measurements from the air quality monitoring network of the city, remote satellite measurements, and simulations of traffic activity and road transport emissions allowed us to quantify the change in the average concentrations of each pollutant. Average relative changes of traffic emissions (between 61% and 68%) implied statistically significant concentrations reductions of 54%, 13%, and 11% for NOx, CO, and PM2.5, respectively, during the pandemic period compared to historical period. In contrast, the average concentration of O3 increased by 63% during 2020 compared to 2017-2019. The nonlinear response observed in the pollution levels can be attributed to the changes in the vehicular emission patterns during the pandemic and to the role of other sources such as residential emissions or secondary PM.
在新冠疫情期间实施的限制措施和物理距离措施,限制了人们的活动和出行,这使我们能够研究这些措施如何影响污染率高的城市地区的空气质量,比如智利的圣地亚哥。本文呈现了2020年3月至5月期间PM10、PM2.5、氮氧化物、一氧化碳和臭氧的浓度与2017 - 2019年同期相应浓度的对比研究。结合城市空气质量监测网络的地面测量、卫星遥感测量以及交通活动和道路运输排放的模拟,我们得以量化每种污染物平均浓度的变化。交通排放的平均相对变化(在61%至68%之间)意味着,与历史时期相比,疫情期间氮氧化物、一氧化碳和PM2.5的浓度分别显著降低了54%、13%和11%。相比之下,2020年臭氧的平均浓度相较于2017 - 2019年增加了63%。在污染水平上观察到的非线性响应可归因于疫情期间车辆排放模式变化以及其他来源(如居民排放或二次颗粒物)的作用。