• 文献检索
  • 文档翻译
  • 深度研究
  • 学术资讯
  • Suppr Zotero 插件Zotero 插件
  • 邀请有礼
  • 套餐&价格
  • 历史记录
应用&插件
Suppr Zotero 插件Zotero 插件浏览器插件Mac 客户端Windows 客户端微信小程序
定价
高级版会员购买积分包购买API积分包
服务
文献检索文档翻译深度研究API 文档MCP 服务
关于我们
关于 Suppr公司介绍联系我们用户协议隐私条款
关注我们

Suppr 超能文献

核心技术专利:CN118964589B侵权必究
粤ICP备2023148730 号-1Suppr @ 2026

文献检索

告别复杂PubMed语法,用中文像聊天一样搜索,搜遍4000万医学文献。AI智能推荐,让科研检索更轻松。

立即免费搜索

文件翻译

保留排版,准确专业,支持PDF/Word/PPT等文件格式,支持 12+语言互译。

免费翻译文档

深度研究

AI帮你快速写综述,25分钟生成高质量综述,智能提取关键信息,辅助科研写作。

立即免费体验

COVID-19 发病数据的时空分析。

Spatiotemporal Analysis of COVID-19 Incidence Data.

机构信息

Istituto Nazionale di Geofisica e Vulcanologia, Via di Vigna Murata 605, 00143 Rome, Italy.

Istituto per le Applicazioni del Calcolo Mauro Picone, Consiglio Nazionale delle Ricerche, Via dei Taurini 19, 00185 Rome, Italy.

出版信息

Viruses. 2021 Mar 11;13(3):463. doi: 10.3390/v13030463.

DOI:10.3390/v13030463
PMID:33799900
原文链接:https://pmc.ncbi.nlm.nih.gov/articles/PMC8001833/
Abstract

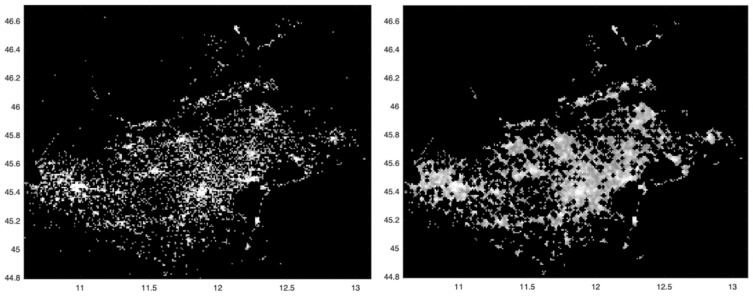
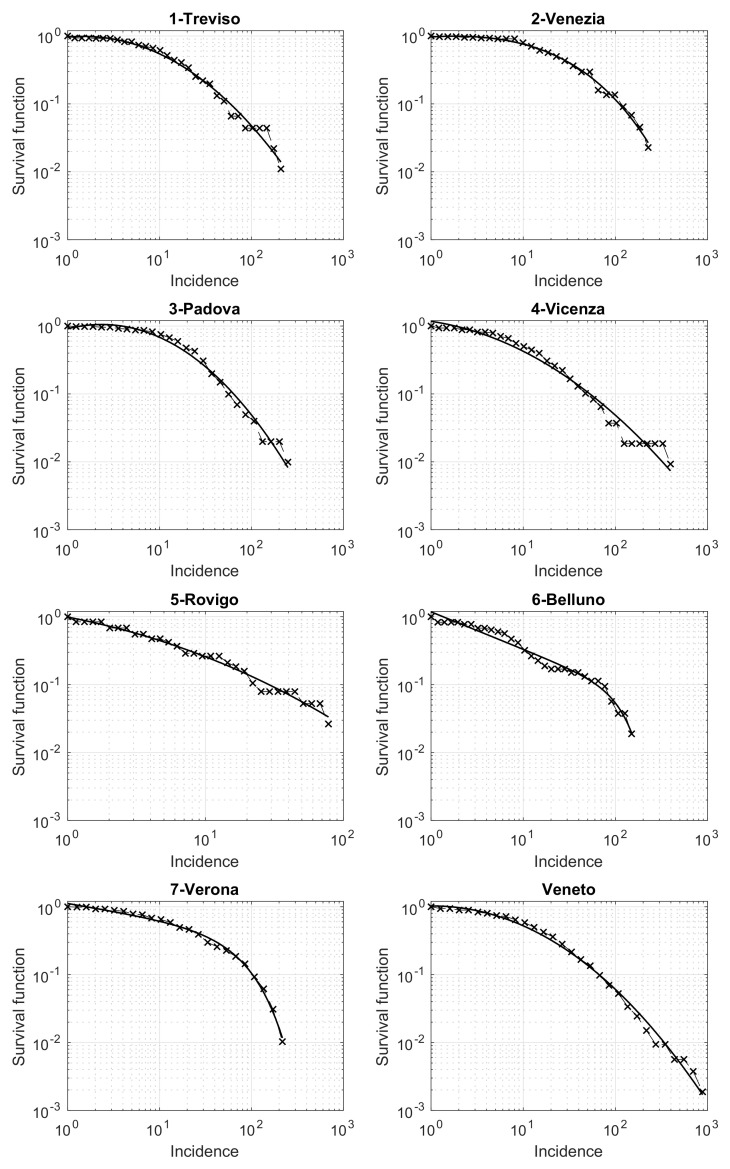
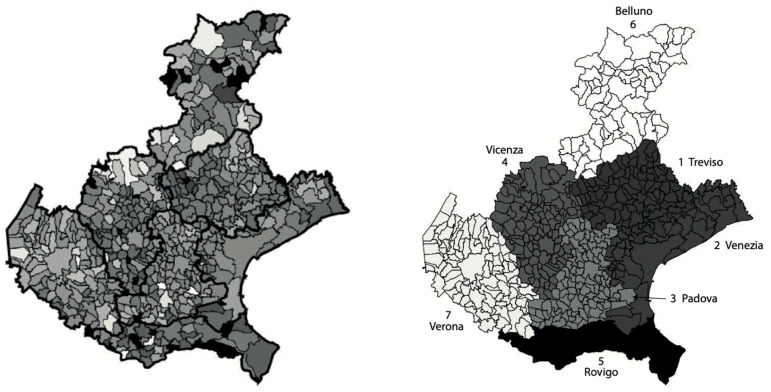
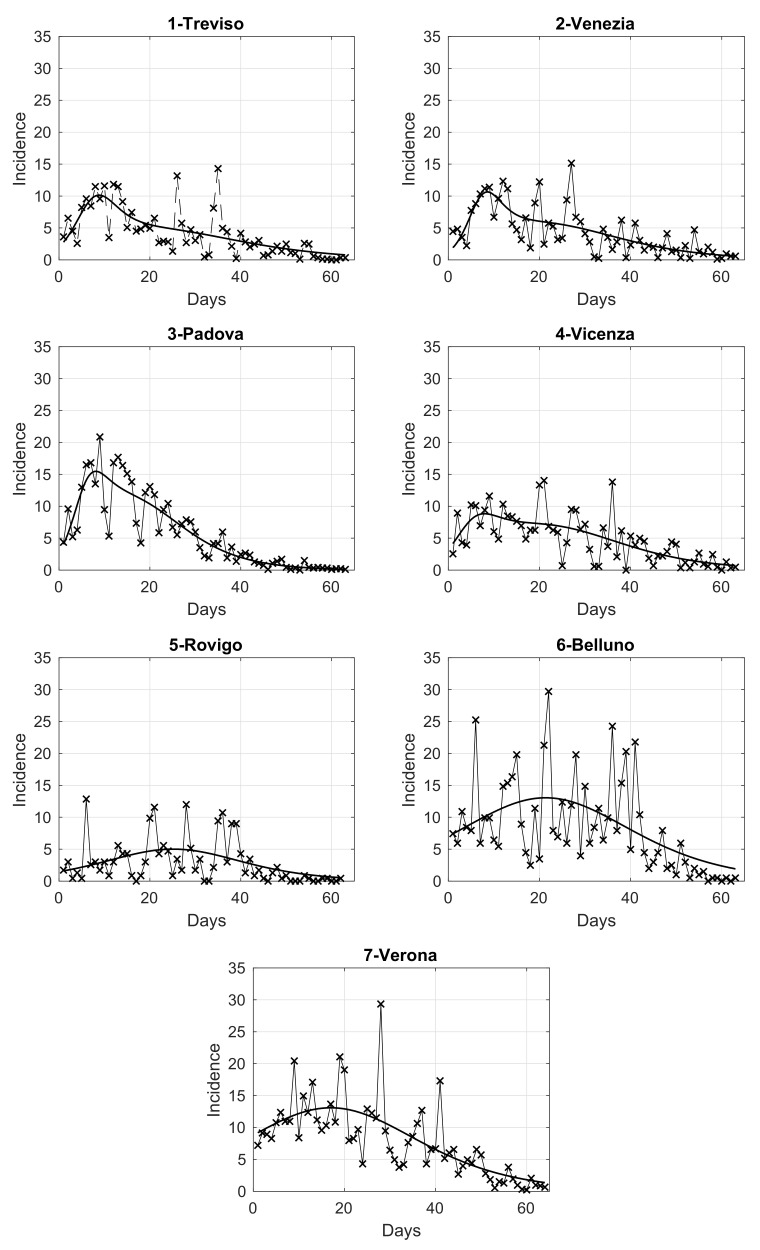
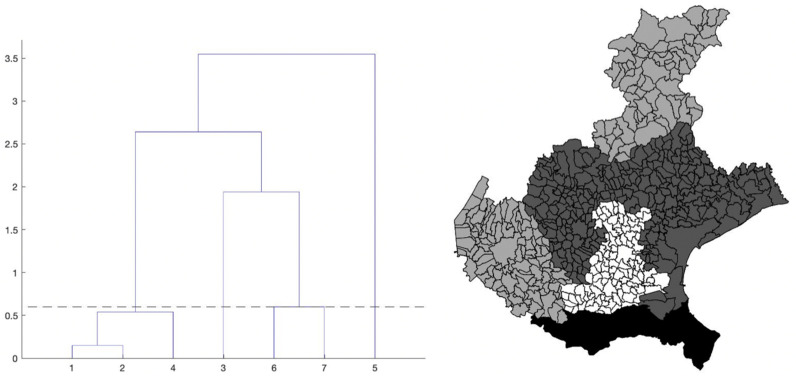
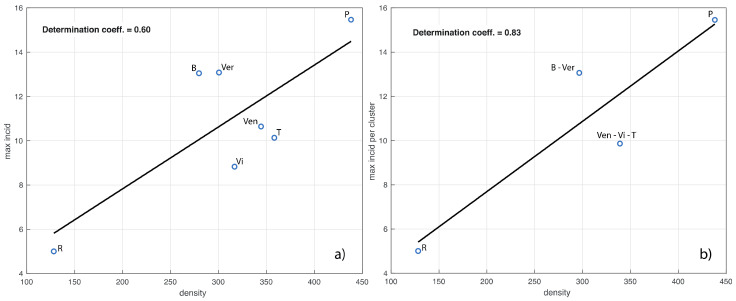
(1) Background: A better understanding of COVID-19 dynamics in terms of interactions among individuals would be of paramount importance to increase the effectiveness of containment measures. Despite this, the research lacks spatiotemporal statistical and mathematical analysis based on large datasets. We describe a novel methodology to extract useful spatiotemporal information from COVID-19 pandemic data. (2) Methods: We perform specific analyses based on mathematical and statistical tools, like mathematical morphology, hierarchical clustering, parametric data modeling and non-parametric statistics. These analyses are here applied to the large dataset consisting of about 19,000 COVID-19 patients in the Veneto region (Italy) during the entire Italian national lockdown. (3) Results: We estimate the COVID-19 cumulative incidence spatial distribution, significantly reducing image noise. We identify four clusters of connected provinces based on the temporal evolution of the incidence. Surprisingly, while one cluster consists of three neighboring provinces, another one contains two provinces more than 210 km apart by highway. The survival function of the local spatial incidence values is modeled here by a tapered Pareto model, also used in other applied fields like seismology and economy in connection to networks. Model's parameters could be relevant to describe quantitatively the epidemic. (4) Conclusion: The proposed methodology can be applied to a general situation, potentially helping to adopt strategic decisions such as the restriction of mobility and gatherings.

摘要

(1) 背景:更好地理解 COVID-19 在个体之间的相互作用的动态,对于提高控制措施的有效性至关重要。尽管如此,这项研究仍缺乏基于大型数据集的时空统计和数学分析。我们描述了一种从 COVID-19 大流行数据中提取有用时空信息的新方法。(2) 方法:我们使用数学和统计工具,如数学形态学、层次聚类、参数数据建模和非参数统计,进行特定的分析。这些分析应用于包含约 19000 名 COVID-19 患者的大型数据集,这些患者在意大利全国封锁期间分布在威尼托地区(意大利)。(3) 结果:我们估计了 COVID-19 的累积发病率的空间分布,显著降低了图像噪声。我们根据发病率的时间演变确定了四个连接的省份集群。令人惊讶的是,虽然一个集群由三个相邻的省份组成,但另一个集群却包含了两个相隔 210 公里以上的高速公路省份。本地空间发病率值的生存函数由锥形帕累托模型建模,该模型也用于其他应用领域,如地震学和与网络相关的经济学。模型的参数可以用来定量描述疫情。(4) 结论:所提出的方法可以应用于一般情况,可能有助于做出战略决策,如限制流动性和集会。

https://cdn.ncbi.nlm.nih.gov/pmc/blobs/6004/8001833/e51e135e82cb/viruses-13-00463-g006.jpg
https://cdn.ncbi.nlm.nih.gov/pmc/blobs/6004/8001833/25e282877c3e/viruses-13-00463-g001.jpg
https://cdn.ncbi.nlm.nih.gov/pmc/blobs/6004/8001833/87d024238212/viruses-13-00463-g002.jpg
https://cdn.ncbi.nlm.nih.gov/pmc/blobs/6004/8001833/bc30ab877162/viruses-13-00463-g003.jpg
https://cdn.ncbi.nlm.nih.gov/pmc/blobs/6004/8001833/0095a57e8403/viruses-13-00463-g004.jpg
https://cdn.ncbi.nlm.nih.gov/pmc/blobs/6004/8001833/f877643ca31a/viruses-13-00463-g005.jpg
https://cdn.ncbi.nlm.nih.gov/pmc/blobs/6004/8001833/e51e135e82cb/viruses-13-00463-g006.jpg

相似文献

1
Spatiotemporal Analysis of COVID-19 Incidence Data.COVID-19 发病数据的时空分析。
Viruses. 2021 Mar 11;13(3):463. doi: 10.3390/v13030463.
2
Spatio-temporal distribution characteristics of COVID-19 in China: a city-level modeling study.中国新冠肺炎的时空分布特征:一项城市层面的建模研究
BMC Infect Dis. 2021 Aug 14;21(1):816. doi: 10.1186/s12879-021-06515-8.
3
Modelling and predicting the spatio-temporal spread of cOVID-19 in Italy.建模并预测 COVID-19 在意大利的时空传播。
BMC Infect Dis. 2020 Sep 23;20(1):700. doi: 10.1186/s12879-020-05415-7.
4
Spatiotemporal evolution of COVID-19 in Portugal's Mainland with self-organizing maps.利用自组织映射研究葡萄牙本土 COVID-19 的时空演变。
Int J Health Geogr. 2023 Jan 29;22(1):4. doi: 10.1186/s12942-022-00322-3.
5
Spatiotemporal cluster analysis of COVID-19 and its relationship with environmental factors at the city level in mainland China.中国大陆城市层面 COVID-19 的时空聚集分析及其与环境因素的关系。
Environ Sci Pollut Res Int. 2022 Feb;29(9):13386-13395. doi: 10.1007/s11356-021-16600-9. Epub 2021 Sep 30.
6
Understanding spatiotemporal patterns of COVID-19 incidence in Portugal: A functional data analysis from August 2020 to March 2022.理解葡萄牙 COVID-19 发病率的时空模式:2020 年 8 月至 2022 年 3 月的功能数据分析。
PLoS One. 2024 Feb 1;19(2):e0297772. doi: 10.1371/journal.pone.0297772. eCollection 2024.
7
Classification of weekly provincial overall age- and gender-specific mortality patterns during the COVID-19 epidemics in Italy.意大利 COVID-19 疫情期间每周省级全年龄段和性别特定死亡率模式分类。
Epidemiol Prev. 2020 Sep-Dec;44(5-6 Suppl 2):271-281. doi: 10.19191/EP20.5-6.S2.127.
8
Revealing the spatial shifting pattern of COVID-19 pandemic in the United States.揭示美国 COVID-19 大流行的空间转移模式。
Sci Rep. 2021 Apr 19;11(1):8396. doi: 10.1038/s41598-021-87902-8.
9
Folic acid supplementation and malaria susceptibility and severity among people taking antifolate antimalarial drugs in endemic areas.在流行地区,服用抗叶酸抗疟药物的人群中,叶酸补充剂与疟疾易感性和严重程度的关系。
Cochrane Database Syst Rev. 2022 Feb 1;2(2022):CD014217. doi: 10.1002/14651858.CD014217.
10
Detection of SARS-CoV-2 infection clusters: The useful combination of spatiotemporal clustering and genomic analyses.检测 SARS-CoV-2 感染集群:时空聚类和基因组分析的有益结合。
Front Public Health. 2022 Dec 1;10:1016169. doi: 10.3389/fpubh.2022.1016169. eCollection 2022.

引用本文的文献

1
Understanding epidemic spread patterns: a visual analysis approach.理解疫情传播模式:一种可视化分析方法。
Health Syst (Basingstoke). 2024 Jan 25;13(3):229-245. doi: 10.1080/20476965.2024.2308286. eCollection 2024.
2
The epidemic forest reveals the spatial pattern of the spread of acute respiratory infections in Jakarta, Indonesia.疫情森林揭示了印度尼西亚雅加达急性呼吸道感染传播的空间模式。
Sci Rep. 2024 Apr 1;14(1):7619. doi: 10.1038/s41598-024-58390-3.
3
New Insights into the Estimation of Reproduction Numbers during an Epidemic.

本文引用的文献

1
The First Three Months of COVID-19: Epidemiological Evidence for Two SARS-CoV-2 Strains Spreading and Implications for Prevention Strategies.新冠疫情的头三个月:两种新冠病毒毒株传播的流行病学证据及其对预防策略的启示
Cureus. 2022 Sep 14;14(9):e29146. doi: 10.7759/cureus.29146. eCollection 2022 Sep.
2
Vaccination Criteria Based on Factors Influencing COVID-19 Diffusion and Mortality.基于影响新冠病毒传播和死亡率因素的疫苗接种标准
Vaccines (Basel). 2020 Dec 15;8(4):766. doi: 10.3390/vaccines8040766.
3
Spatial analysis of COVID-19 spread in Iran: Insights into geographical and structural transmission determinants at a province level.
疫情期间繁殖数估计的新见解
Vaccines (Basel). 2022 Oct 25;10(11):1788. doi: 10.3390/vaccines10111788.
4
Spatiotemporal analysis of the morbidity of global Omicron from November 2021 to February 2022.2021 年 11 月至 2022 年 2 月期间全球奥密克戎发病率的时空分析。
J Med Virol. 2022 Nov;94(11):5354-5362. doi: 10.1002/jmv.28013. Epub 2022 Jul 29.
5
Efficacy versus abundancy: Comparing vaccination schemes.功效与数量:比较疫苗接种方案。
PLoS One. 2022 May 12;17(5):e0267840. doi: 10.1371/journal.pone.0267840. eCollection 2022.
6
Clustering of countries according to the COVID-19 incidence and mortality rates.根据 COVID-19 发病率和死亡率对国家进行聚类。
BMC Public Health. 2022 Apr 1;22(1):632. doi: 10.1186/s12889-022-13086-z.
7
Spatial Dynamics and Multiscale Regression Modelling of Population Level Indicators for COVID-19 Spread in Malaysia.马来西亚 COVID-19 传播的人口水平指标的空间动态和多尺度回归建模。
Int J Environ Res Public Health. 2022 Feb 13;19(4):2082. doi: 10.3390/ijerph19042082.
8
Modeling of the Long-Term Epidemic Dynamics of COVID-19 in the United States.美国新冠疫情长期流行动态建模
Int J Environ Res Public Health. 2021 Jul 16;18(14):7594. doi: 10.3390/ijerph18147594.
伊朗 COVID-19 传播的空间分析:省级层面地理和结构传播决定因素的见解。
PLoS Negl Trop Dis. 2020 Nov 18;14(11):e0008875. doi: 10.1371/journal.pntd.0008875. eCollection 2020 Nov.
4
COVID-19 cumulative incidence, intensive care, and mortality in Italian regions compared to selected European countries.意大利各地区与部分欧洲国家 COVID-19 累计发病率、重症监护和死亡率比较。
Int J Infect Dis. 2021 Jan;102:363-368. doi: 10.1016/j.ijid.2020.10.070. Epub 2020 Oct 30.
5
Comparison of spatiotemporal characteristics of the COVID-19 and SARS outbreaks in mainland China.比较中国大陆 COVID-19 和 SARS 疫情的时空特征。
BMC Infect Dis. 2020 Oct 30;20(1):805. doi: 10.1186/s12879-020-05537-y.
6
Modelling and predicting the spatio-temporal spread of cOVID-19 in Italy.建模并预测 COVID-19 在意大利的时空传播。
BMC Infect Dis. 2020 Sep 23;20(1):700. doi: 10.1186/s12879-020-05415-7.
7
A global-scale ecological niche model to predict SARS-CoV-2 coronavirus infection rate.一种用于预测SARS-CoV-2冠状病毒感染率的全球尺度生态位模型。
Ecol Modell. 2020 Sep 1;431:109187. doi: 10.1016/j.ecolmodel.2020.109187. Epub 2020 Jun 20.
8
On the emergence of a power law in the distribution of COVID-19 cases.关于新冠病毒疾病病例分布中幂律的出现。
Physica D. 2020 Nov;412:132649. doi: 10.1016/j.physd.2020.132649. Epub 2020 Jul 16.
9
Spatial analysis and GIS in the study of COVID-19. A review.空间分析和 GIS 在 COVID-19 研究中的应用。综述。
Sci Total Environ. 2020 Oct 15;739:140033. doi: 10.1016/j.scitotenv.2020.140033. Epub 2020 Jun 8.
10
Clinical course and risk factors for mortality of adult inpatients with COVID-19 in Wuhan, China: a retrospective cohort study.中国武汉成人 COVID-19 住院患者的临床病程和死亡危险因素:一项回顾性队列研究。
Lancet. 2020 Mar 28;395(10229):1054-1062. doi: 10.1016/S0140-6736(20)30566-3. Epub 2020 Mar 11.