• 文献检索
  • 文档翻译
  • 深度研究
  • 学术资讯
  • Suppr Zotero 插件Zotero 插件
  • 邀请有礼
  • 套餐&价格
  • 历史记录
应用&插件
Suppr Zotero 插件Zotero 插件浏览器插件Mac 客户端Windows 客户端微信小程序
定价
高级版会员购买积分包购买API积分包
服务
文献检索文档翻译深度研究API 文档MCP 服务
关于我们
关于 Suppr公司介绍联系我们用户协议隐私条款
关注我们

Suppr 超能文献

核心技术专利:CN118964589B侵权必究
粤ICP备2023148730 号-1Suppr @ 2026

文献检索

告别复杂PubMed语法,用中文像聊天一样搜索,搜遍4000万医学文献。AI智能推荐,让科研检索更轻松。

立即免费搜索

文件翻译

保留排版,准确专业,支持PDF/Word/PPT等文件格式,支持 12+语言互译。

免费翻译文档

深度研究

AI帮你快速写综述,25分钟生成高质量综述,智能提取关键信息,辅助科研写作。

立即免费体验

利用自组织映射研究葡萄牙本土 COVID-19 的时空演变。

Spatiotemporal evolution of COVID-19 in Portugal's Mainland with self-organizing maps.

机构信息

Formely: Instituto Superior Técnico, Universidade de Lisboa, Av. Rovisco Pais, 1049-001, Lisbon, Portugal.

CERENA/DER, Instituto Superior Técnico, Universidade de Lisboa, Av. Rovisco Pais, 1049-001, Lisbon, Portugal.

出版信息

Int J Health Geogr. 2023 Jan 29;22(1):4. doi: 10.1186/s12942-022-00322-3.

DOI:10.1186/s12942-022-00322-3
PMID:36710328
原文链接:https://pmc.ncbi.nlm.nih.gov/articles/PMC9884330/
Abstract

BACKGROUND

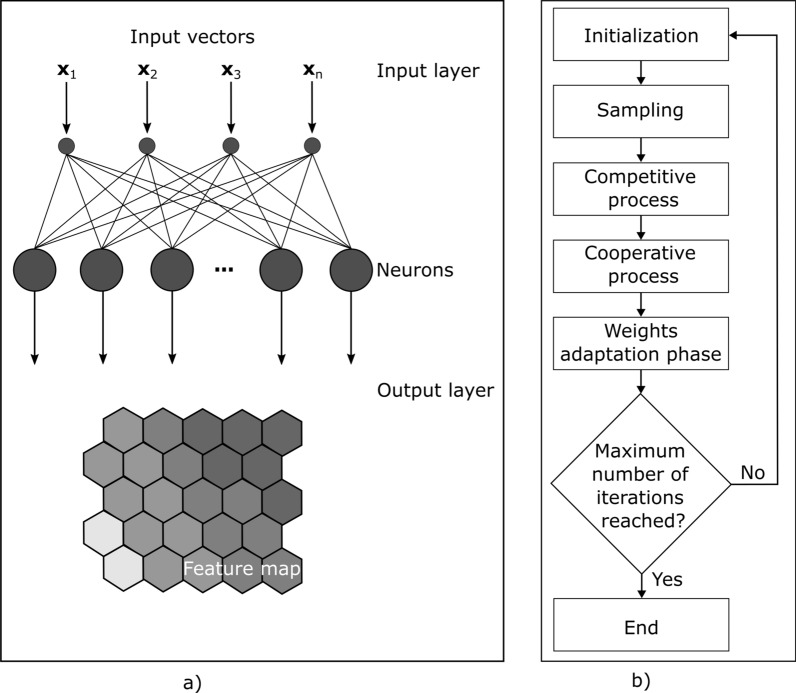
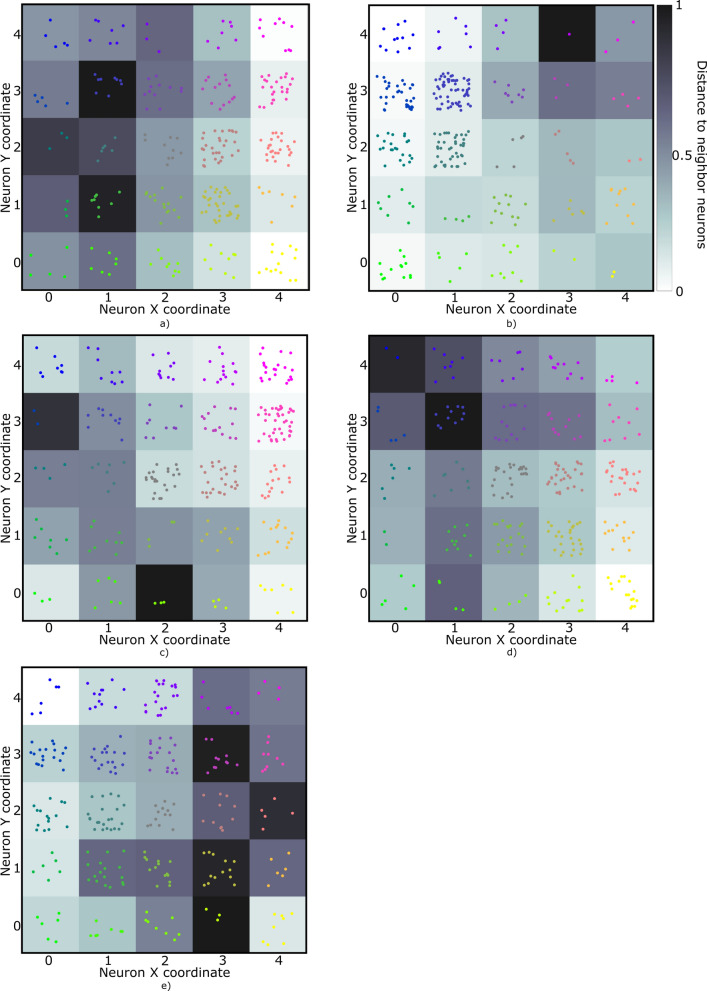
Self-Organizing Maps (SOM) are an unsupervised learning clustering and dimensionality reduction algorithm capable of mapping an initial complex high-dimensional data set into a low-dimensional domain, such as a two-dimensional grid of neurons. In the reduced space, the original complex patterns and their interactions can be better visualized, interpreted and understood.

METHODS

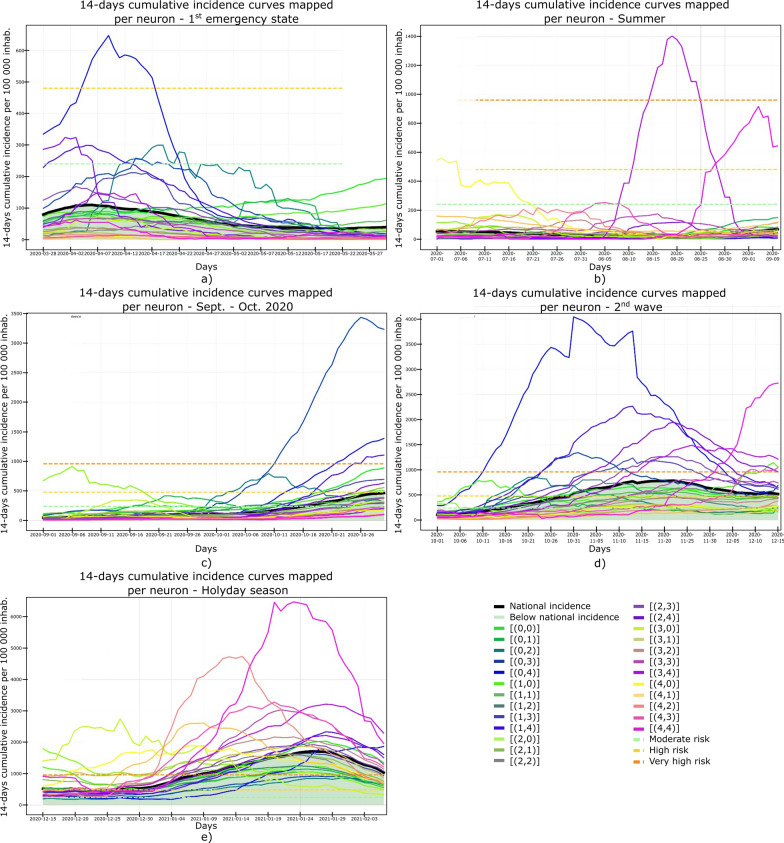
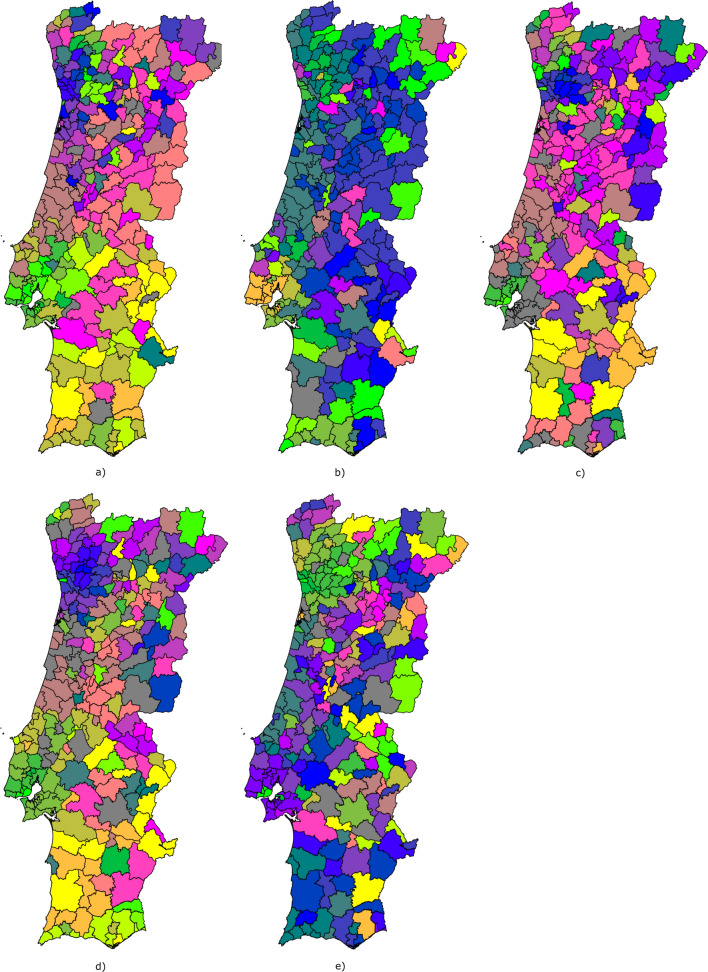
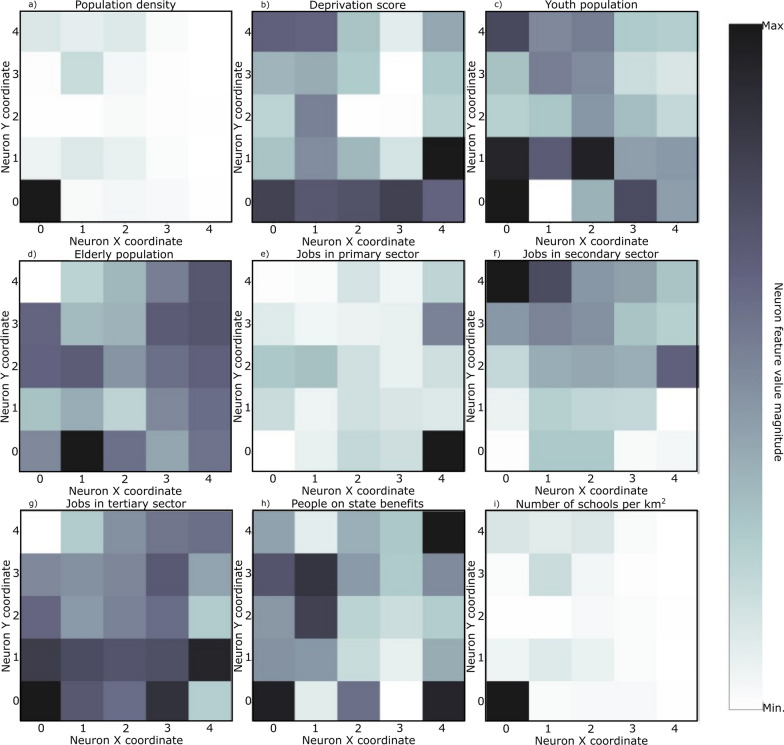
We use SOM to simultaneously couple the spatial and temporal domains of the COVID-19 evolution in the 278 municipalities of mainland Portugal during the first year of the pandemic. Temporal 14-days cumulative incidence time series along with socio-economic and demographic indicators per municipality were analyzed with SOM to identify regions of the country with similar behavior and infer the possible common origins of the incidence evolution.

RESULTS

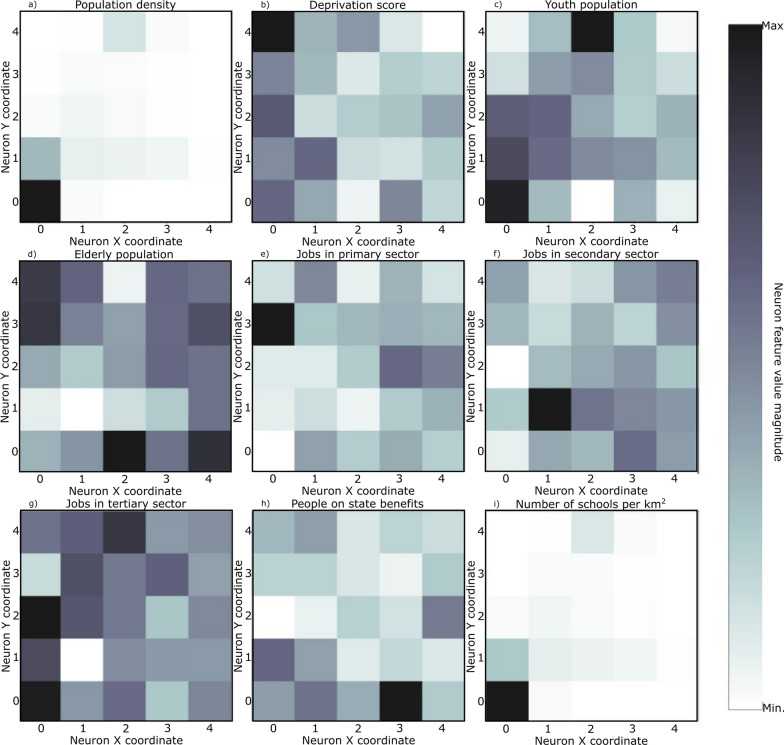
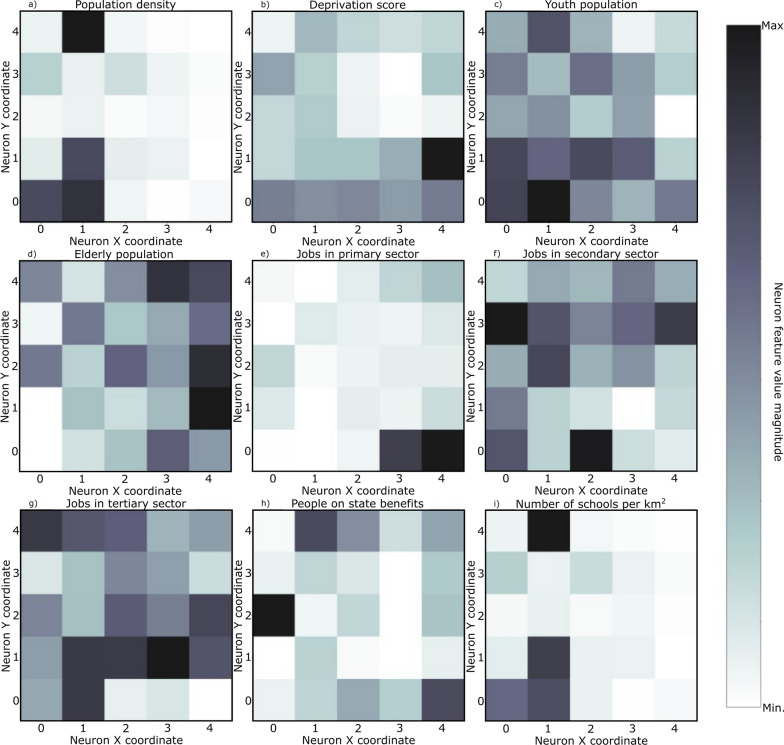
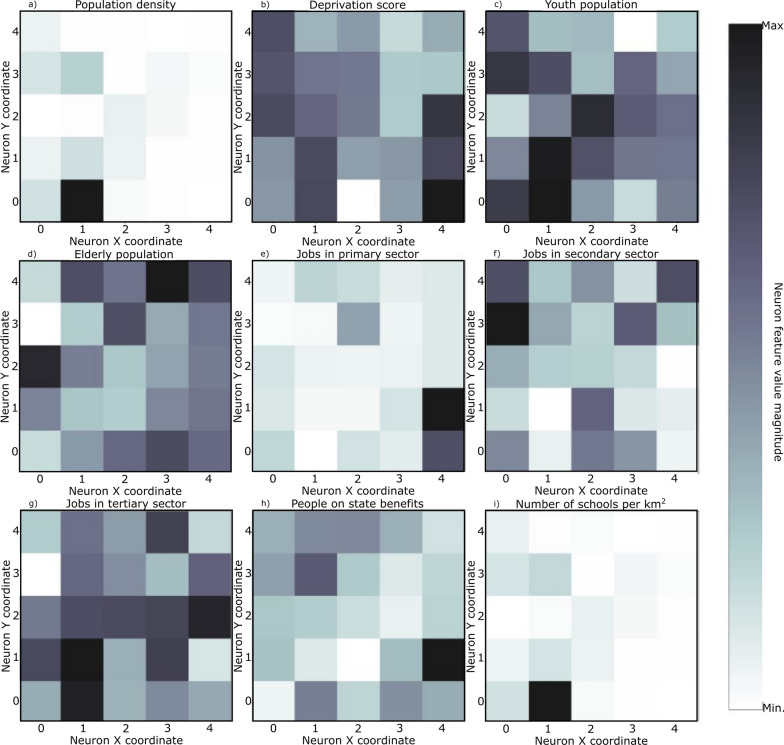
The results show how neighbor municipalities tend to share a similar behavior of the disease, revealing the strong spatiotemporal relationship of the COVID-19 spreading beyond the administrative borders of each municipality. Additionally, we demonstrate how local socio-economic and demographic characteristics evolved as determinants of COVID-19 transmission, during the 1st wave school density per municipality was more relevant, where during 2nd wave jobs in the secondary sector and the deprivation score were more relevant.

CONCLUSIONS

The results show that SOM can be an effective tool to analysing the spatiotemporal behavior of COVID-19 and synthetize the history of the disease in mainland Portugal during the period in analysis. While SOM have been applied to diverse scientific fields, the application of SOM to study the spatiotemporal evolution of COVID-19 is still limited. This work illustrates how SOM can be used to describe the spatiotemporal behavior of epidemic events. While the example shown herein uses 14-days cumulative incidence curves, the same analysis can be performed using other relevant data such as mortality data, vaccination rates or even infection rates of other disease of infectious nature.

摘要

背景

自组织映射(SOM)是一种无监督学习聚类和降维算法,能够将初始复杂的高维数据集映射到低维域,例如神经元的二维网格。在降维空间中,可以更好地可视化、解释和理解原始复杂模式及其相互作用。

方法

我们使用 SOM 同时耦合 COVID-19 在葡萄牙大陆 278 个直辖市第一年的演变的时空域。对每个直辖市的时空 14 天累计发病率时间序列以及社会经济和人口指标进行 SOM 分析,以识别具有相似行为的国家区域,并推断发病率演变的可能共同起源。

结果

结果表明,相邻直辖市往往具有相似的疾病行为,揭示了 COVID-19 传播超越每个直辖市行政边界的强时空关系。此外,我们还展示了当地社会经济和人口特征如何作为 COVID-19 传播的决定因素演变,在第一波期间,每个直辖市的学校密度更为重要,而在第二波期间,次要部门的工作和剥夺分数更为重要。

结论

结果表明,SOM 可以成为分析 COVID-19 时空行为并综合分析分析期间葡萄牙大陆疾病历史的有效工具。虽然 SOM 已应用于多个科学领域,但 SOM 应用于研究 COVID-19 的时空演变仍然有限。这项工作说明了如何使用 SOM 来描述传染病事件的时空行为。虽然此处所示的示例使用了 14 天的累计发病率曲线,但可以使用其他相关数据(例如死亡率数据、疫苗接种率甚至其他传染病的感染率)进行相同的分析。

https://cdn.ncbi.nlm.nih.gov/pmc/blobs/4f76/9884425/02f37adf7c9d/12942_2022_322_Fig11_HTML.jpg
https://cdn.ncbi.nlm.nih.gov/pmc/blobs/4f76/9884425/06977b52a9c8/12942_2022_322_Fig1_HTML.jpg
https://cdn.ncbi.nlm.nih.gov/pmc/blobs/4f76/9884425/9b617c7bd27a/12942_2022_322_Fig2_HTML.jpg
https://cdn.ncbi.nlm.nih.gov/pmc/blobs/4f76/9884425/5129b90f035b/12942_2022_322_Fig3_HTML.jpg
https://cdn.ncbi.nlm.nih.gov/pmc/blobs/4f76/9884425/cec143eb727c/12942_2022_322_Fig4_HTML.jpg
https://cdn.ncbi.nlm.nih.gov/pmc/blobs/4f76/9884425/b576b56d0c4a/12942_2022_322_Fig5_HTML.jpg
https://cdn.ncbi.nlm.nih.gov/pmc/blobs/4f76/9884425/92d64267f0f1/12942_2022_322_Fig6_HTML.jpg
https://cdn.ncbi.nlm.nih.gov/pmc/blobs/4f76/9884425/11a17eb4a692/12942_2022_322_Fig7_HTML.jpg
https://cdn.ncbi.nlm.nih.gov/pmc/blobs/4f76/9884425/496af7253973/12942_2022_322_Fig8_HTML.jpg
https://cdn.ncbi.nlm.nih.gov/pmc/blobs/4f76/9884425/5c1466c54cfb/12942_2022_322_Fig9_HTML.jpg
https://cdn.ncbi.nlm.nih.gov/pmc/blobs/4f76/9884425/ca3fb7eee1a0/12942_2022_322_Fig10_HTML.jpg
https://cdn.ncbi.nlm.nih.gov/pmc/blobs/4f76/9884425/02f37adf7c9d/12942_2022_322_Fig11_HTML.jpg

相似文献

1
Spatiotemporal evolution of COVID-19 in Portugal's Mainland with self-organizing maps.利用自组织映射研究葡萄牙本土 COVID-19 的时空演变。
Int J Health Geogr. 2023 Jan 29;22(1):4. doi: 10.1186/s12942-022-00322-3.
2
Understanding spatiotemporal patterns of COVID-19 incidence in Portugal: A functional data analysis from August 2020 to March 2022.理解葡萄牙 COVID-19 发病率的时空模式:2020 年 8 月至 2022 年 3 月的功能数据分析。
PLoS One. 2024 Feb 1;19(2):e0297772. doi: 10.1371/journal.pone.0297772. eCollection 2024.
3
Uncovering COVID-19 infection determinants in Portugal: towards an evidence-based spatial susceptibility index to support epidemiological containment policies.揭示葡萄牙 COVID-19 感染决定因素:构建基于证据的空间易感性指数,以支持流行病学遏制政策。
Int J Health Geogr. 2023 Apr 6;22(1):8. doi: 10.1186/s12942-023-00329-4.
4
Folic acid supplementation and malaria susceptibility and severity among people taking antifolate antimalarial drugs in endemic areas.在流行地区,服用抗叶酸抗疟药物的人群中,叶酸补充剂与疟疾易感性和严重程度的关系。
Cochrane Database Syst Rev. 2022 Feb 1;2(2022):CD014217. doi: 10.1002/14651858.CD014217.
5
Geostatistical COVID-19 infection risk maps for Portugal.葡萄牙的 COVID-19 感染风险地理统计学地图。
Int J Health Geogr. 2020 Jul 6;19(1):25. doi: 10.1186/s12942-020-00221-5.
6
The Spread of the COVID-19 Outbreak in Brazil: An Overview by Kohonen Self-Organizing Map Networks.《基于 Kohonen 自组织映射网络的巴西 COVID-19 疫情传播概述》。
Medicina (Kaunas). 2021 Mar 3;57(3):235. doi: 10.3390/medicina57030235.
7
Spatio-temporal distribution characteristics of COVID-19 in China: a city-level modeling study.中国新冠肺炎的时空分布特征:一项城市层面的建模研究
BMC Infect Dis. 2021 Aug 14;21(1):816. doi: 10.1186/s12879-021-06515-8.
8
Comparison of spatiotemporal characteristics of the COVID-19 and SARS outbreaks in mainland China.比较中国大陆 COVID-19 和 SARS 疫情的时空特征。
BMC Infect Dis. 2020 Oct 30;20(1):805. doi: 10.1186/s12879-020-05537-y.
9
Spatiotemporal Analysis of COVID-19 Incidence Data.COVID-19 发病数据的时空分析。
Viruses. 2021 Mar 11;13(3):463. doi: 10.3390/v13030463.
10
Epidemiological characteristics and dynamic transmissions of COVID-19 pandemics in Chinese mainland: A trajectory clustering perspective analysis.中国大陆 COVID-19 大流行的流行病学特征和动态传播:轨迹聚类分析视角。
Epidemics. 2023 Dec;45:100719. doi: 10.1016/j.epidem.2023.100719. Epub 2023 Sep 26.

引用本文的文献

1
Understanding spatiotemporal patterns of COVID-19 incidence in Portugal: A functional data analysis from August 2020 to March 2022.理解葡萄牙 COVID-19 发病率的时空模式:2020 年 8 月至 2022 年 3 月的功能数据分析。
PLoS One. 2024 Feb 1;19(2):e0297772. doi: 10.1371/journal.pone.0297772. eCollection 2024.
2
Uncovering COVID-19 infection determinants in Portugal: towards an evidence-based spatial susceptibility index to support epidemiological containment policies.揭示葡萄牙 COVID-19 感染决定因素:构建基于证据的空间易感性指数,以支持流行病学遏制政策。
Int J Health Geogr. 2023 Apr 6;22(1):8. doi: 10.1186/s12942-023-00329-4.

本文引用的文献

1
Interval type-3 fuzzy aggregators for ensembles of neural networks in COVID-19 time series prediction.用于新冠疫情时间序列预测的神经网络集成的区间三型模糊聚合器
Eng Appl Artif Intell. 2022 Sep;114:105110. doi: 10.1016/j.engappai.2022.105110. Epub 2022 Jun 27.
2
Estimating and simulating a SIRD Model of COVID-19 for many countries, states, and cities.为许多国家、州和城市估计和模拟新冠疫情的易感-感染-康复-死亡(SIRD)模型。
J Econ Dyn Control. 2022 Jul;140:104318. doi: 10.1016/j.jedc.2022.104318. Epub 2022 Jan 29.
3
Increasing risk of breakthrough COVID-19 in outbreaks with high attack rates in European long-term care facilities, July to October 2021.
2021 年 7 月至 10 月,高发病率的欧洲长期护理机构爆发新冠疫情,突破性感染风险增加。
Euro Surveill. 2021 Dec;26(49). doi: 10.2807/1560-7917.ES.2021.26.49.2101070.
4
Temperature and population density influence SARS-CoV-2 transmission in the absence of nonpharmaceutical interventions.在没有非药物干预措施的情况下,温度和人口密度会影响 SARS-CoV-2 的传播。
Proc Natl Acad Sci U S A. 2021 Jun 22;118(25). doi: 10.1073/pnas.2019284118.
5
The Spread of the COVID-19 Outbreak in Brazil: An Overview by Kohonen Self-Organizing Map Networks.《基于 Kohonen 自组织映射网络的巴西 COVID-19 疫情传播概述》。
Medicina (Kaunas). 2021 Mar 3;57(3):235. doi: 10.3390/medicina57030235.
6
Data and Policy to Guide Opening Schools Safely to Limit the Spread of SARS-CoV-2 Infection.指导学校安全开学以限制新冠病毒感染传播的数据与政策
JAMA. 2021 Mar 2;325(9):823-824. doi: 10.1001/jama.2021.0374.
7
Can Socioeconomic, Health, and Safety Data Explain the Spread of COVID-19 Outbreak on Brazilian Federative Units?社会经济、健康和安全数据能否解释巴西联邦单位 COVID-19 疫情的蔓延?
Int J Environ Res Public Health. 2020 Nov 30;17(23):8921. doi: 10.3390/ijerph17238921.
8
Disparities in COVID-19 Incidence, Hospitalizations, and Testing, by Area-Level Deprivation - Utah, March 3-July 9, 2020.按地区贫困程度划分的 COVID-19 发病率、住院率和检测率的差异-犹他州,2020 年 3 月 3 日至 7 月 9 日。
MMWR Morb Mortal Wkly Rep. 2020 Sep 25;69(38):1369-1373. doi: 10.15585/mmwr.mm6938a4.
9
Geostatistical COVID-19 infection risk maps for Portugal.葡萄牙的 COVID-19 感染风险地理统计学地图。
Int J Health Geogr. 2020 Jul 6;19(1):25. doi: 10.1186/s12942-020-00221-5.
10
Analysis of Spatial Spread Relationships of Coronavirus (COVID-19) Pandemic in the World using Self Organizing Maps.利用自组织映射分析全球冠状病毒(COVID-19)大流行的空间传播关系
Chaos Solitons Fractals. 2020 Sep;138:109917. doi: 10.1016/j.chaos.2020.109917. Epub 2020 May 21.