• 文献检索
  • 文档翻译
  • 深度研究
  • 学术资讯
  • Suppr Zotero 插件Zotero 插件
  • 邀请有礼
  • 套餐&价格
  • 历史记录
应用&插件
Suppr Zotero 插件Zotero 插件浏览器插件Mac 客户端Windows 客户端微信小程序
定价
高级版会员购买积分包购买API积分包
服务
文献检索文档翻译深度研究API 文档MCP 服务
关于我们
关于 Suppr公司介绍联系我们用户协议隐私条款
关注我们

Suppr 超能文献

核心技术专利:CN118964589B侵权必究
粤ICP备2023148730 号-1Suppr @ 2026

文献检索

告别复杂PubMed语法,用中文像聊天一样搜索,搜遍4000万医学文献。AI智能推荐,让科研检索更轻松。

立即免费搜索

文件翻译

保留排版,准确专业,支持PDF/Word/PPT等文件格式,支持 12+语言互译。

免费翻译文档

深度研究

AI帮你快速写综述,25分钟生成高质量综述,智能提取关键信息,辅助科研写作。

立即免费体验

利用地理信息系统对新冠病毒疾病发病率进行时空分析:以伊朗德黑兰大都市区为例的研究

Spatio-temporal analysis of COVID-19 incidence rate using GIS: a case study-Tehran metropolitan, Iran.

作者信息

Nasiri R, Akbarpour S, Zali A R, Khodakarami N, Boochani M H, Noory A R, Soori H

机构信息

Department of Environmental Health Engineering, School of Public Health and Safety, Shahid Beheshti University of Medical Sciences, Tehran, Iran.

Department of Epidemiology and Biostatistics, School of Public Health, Tehran University of Medical Sciences, Tehran, Iran.

出版信息

GeoJournal. 2022;87(4):3291-3305. doi: 10.1007/s10708-021-10438-x. Epub 2021 May 12.

DOI:10.1007/s10708-021-10438-x
PMID:33994652
原文链接:https://pmc.ncbi.nlm.nih.gov/articles/PMC8114020/
Abstract

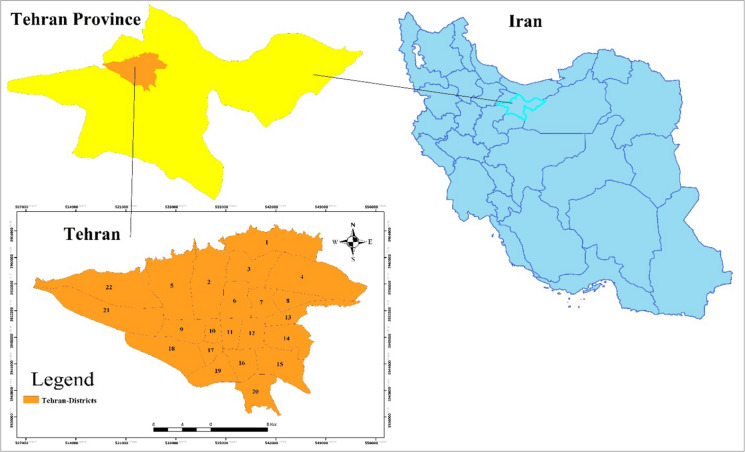
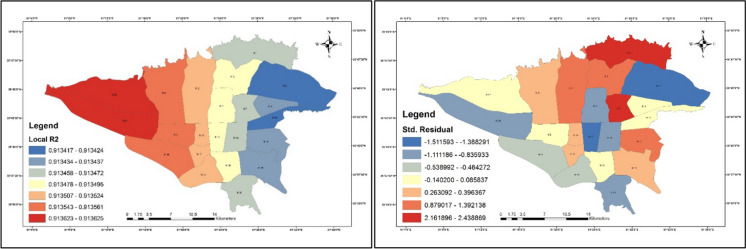
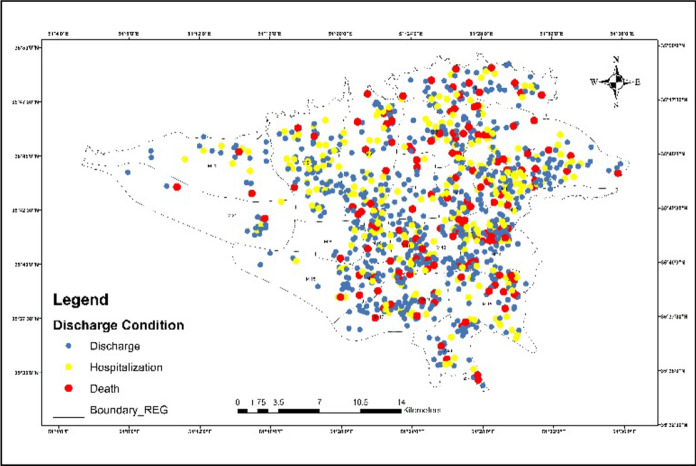
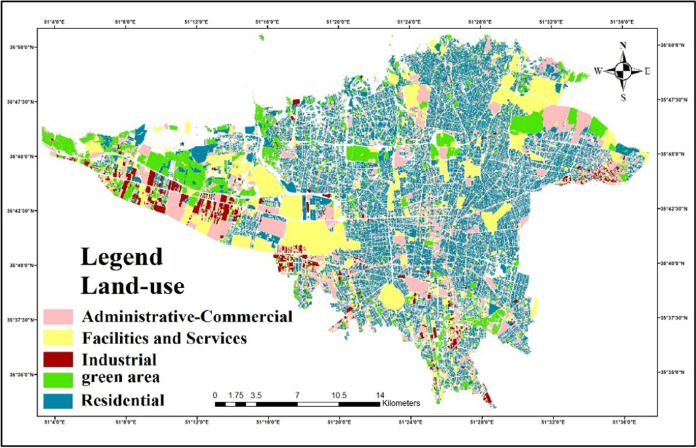
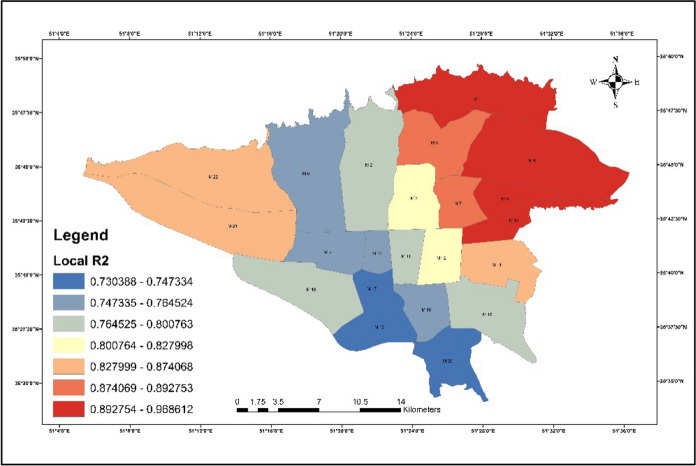
COVID-19 has been distinguished as a zoonotic coronavirus, like SARS coronavirus and MERS coronavirus. Tehran metropolis, as the capital of Iran, has a high density of residents that experienced a high incidence and mortality rates which daily increase the number of death and cases. In this study, the IDW (Inverse Distance Weight), Hotspots, and GWR (Geography Weighted Regression) Model are used as methods for analyzing big data COVID-19 in Tehran. The results showed that the majority of patients and deaths were men, but the death rate was higher in women than in men; also was observed a direct relationship between the area of the houses, and the infected rate, to COVID-19. Also, the results showed a disproportionate distribution of patients in Tehran, although in the eastern regions the number of infected people is higher than in other districts; the eastern areas have a high population density as well as residential land use, and there is a high relationship between population density in residential districts and administrative-commercial and the number of COVID-19 cases in all regions. The outputs of local R were interesting among patients and underlying disorders; the local R between hypertension and neurological diseases was 0.91 and 0.79, respectively, which was higher than other disorders. The highest rates of local R for diabetes and heart disease were 0.67 and 0.55, respectively. From this study, it can be concluded the restrictions must be considered especially, in areas densely populated for all people.

摘要

新型冠状病毒肺炎(COVID-19)已被确认为一种人畜共患的冠状病毒,与严重急性呼吸综合征冠状病毒和中东呼吸综合征冠状病毒类似。德黑兰作为伊朗首都,居民密度高,经历了高发病率和死亡率,每日死亡人数和病例数不断增加。在本研究中,反距离加权法(IDW)、热点分析和地理加权回归(GWR)模型被用作分析德黑兰COVID-19大数据的方法。结果表明,大多数患者和死亡者为男性,但女性死亡率高于男性;还观察到房屋面积与COVID-19感染率之间存在直接关系。此外,结果显示德黑兰患者分布不均衡,尽管东部地区的感染人数高于其他地区;东部地区人口密度高,住宅用地多,居民区人口密度与行政商业区以及所有地区的COVID-19病例数之间存在高度相关性。在患者和潜在疾病中,局部R的结果很有趣;高血压与神经系统疾病之间的局部R分别为0.91和0.79,高于其他疾病。糖尿病和心脏病的局部R最高值分别为0.67和0.55。从这项研究可以得出结论,必须特别考虑在人口密集地区对所有人实施限制措施。

https://cdn.ncbi.nlm.nih.gov/pmc/blobs/9e7c/8114020/d99766114008/10708_2021_10438_Fig10_HTML.jpg
https://cdn.ncbi.nlm.nih.gov/pmc/blobs/9e7c/8114020/c09b5bc5f373/10708_2021_10438_Fig1_HTML.jpg
https://cdn.ncbi.nlm.nih.gov/pmc/blobs/9e7c/8114020/cbb63ca3edfe/10708_2021_10438_Fig2_HTML.jpg
https://cdn.ncbi.nlm.nih.gov/pmc/blobs/9e7c/8114020/408b07fda200/10708_2021_10438_Fig3_HTML.jpg
https://cdn.ncbi.nlm.nih.gov/pmc/blobs/9e7c/8114020/c67dbfba04d7/10708_2021_10438_Fig4_HTML.jpg
https://cdn.ncbi.nlm.nih.gov/pmc/blobs/9e7c/8114020/78432a076cf2/10708_2021_10438_Fig5_HTML.jpg
https://cdn.ncbi.nlm.nih.gov/pmc/blobs/9e7c/8114020/50afbcecae14/10708_2021_10438_Fig6_HTML.jpg
https://cdn.ncbi.nlm.nih.gov/pmc/blobs/9e7c/8114020/3d5873d85c1a/10708_2021_10438_Fig7_HTML.jpg
https://cdn.ncbi.nlm.nih.gov/pmc/blobs/9e7c/8114020/5516afd5af5a/10708_2021_10438_Fig8_HTML.jpg
https://cdn.ncbi.nlm.nih.gov/pmc/blobs/9e7c/8114020/104bd4db6cba/10708_2021_10438_Fig9_HTML.jpg
https://cdn.ncbi.nlm.nih.gov/pmc/blobs/9e7c/8114020/d99766114008/10708_2021_10438_Fig10_HTML.jpg

相似文献

1
Spatio-temporal analysis of COVID-19 incidence rate using GIS: a case study-Tehran metropolitan, Iran.利用地理信息系统对新冠病毒疾病发病率进行时空分析:以伊朗德黑兰大都市区为例的研究
GeoJournal. 2022;87(4):3291-3305. doi: 10.1007/s10708-021-10438-x. Epub 2021 May 12.
2
A description of spatial-temporal patterns of the novel COVID-19 outbreak in the neighbourhoods' scale in Tehran, Iran.伊朗德黑兰社区尺度下新型冠状病毒肺炎疫情的时空模式描述。
Med J Islam Repub Iran. 2021 Oct 4;35:128. doi: 10.47176/mjiri.35.128. eCollection 2021.
3
Spatial analysis of driving accidents leading to deaths related to motorcyclists in Tehran.德黑兰导致摩托车手死亡的交通事故的空间分析。
Chin J Traumatol. 2019 Jun;22(3):148-154. doi: 10.1016/j.cjtee.2018.12.006. Epub 2019 Apr 6.
4
Spatial and temporal analysis of the COVID-19 incidence pattern in Iran.伊朗 COVID-19 发病率模式的时空分析。
Environ Sci Pollut Res Int. 2021 Mar;28(11):13605-13615. doi: 10.1007/s11356-020-11499-0. Epub 2020 Nov 14.
5
Geospatial dynamics of COVID-19 clusters and hotspots in Bangladesh.孟加拉国 COVID-19 集群和热点的地理空间动态。
Transbound Emerg Dis. 2021 Nov;68(6):3643-3657. doi: 10.1111/tbed.13973. Epub 2021 Jan 29.
6
Spatio-temporal patterns of the COVID-19 pandemic, and place-based influential factors at the neighborhood scale in Tehran.新冠疫情在德黑兰的时空模式以及邻里尺度上基于地点的影响因素。
Sustain Cities Soc. 2021 Sep;72:103034. doi: 10.1016/j.scs.2021.103034. Epub 2021 May 21.
7
The Geographical Distribution of Probable COVID-19 Patients Transferred by Tehran Emergency Medical Services; a Cross Sectional Study.德黑兰紧急医疗服务机构转运的疑似新冠病毒病患者的地理分布;一项横断面研究。
Arch Acad Emerg Med. 2021 Mar 10;9(1):e25. doi: 10.22037/aaem.v9i1.1177. eCollection 2021.
8
Inequalities in cancer distribution in tehran; a disaggregated estimation of 2007 incidencea by 22 districts.德黑兰癌症分布的不平等;按22个区对2007年发病率进行的分类估计。
Int J Prev Med. 2012 Jul;3(7):483-92.
9
Spatio-Temporal Modeling of Ozone Distribution in Tehran, Iran Based on Neural Network and Geographical Information System.基于神经网络和地理信息系统的伊朗德黑兰臭氧分布时空建模
Iran J Public Health. 2022 Jan;51(1):196-204. doi: 10.18502/ijph.v51i1.8312.
10
Temporal analysis of the incidence of meningitis in the Tehran metropolitan area, 1999-2005.1999-2005 年德黑兰大都市区脑膜炎发病率的时间分析。
Popul Health Metr. 2009 Dec 23;7:19. doi: 10.1186/1478-7954-7-19.

引用本文的文献

1
Potential physical distance in the open urban grey space of city counties in Poland and COVID-19 cases and deaths throughout the pandemic.波兰城市县开放城市灰色空间中的潜在物理距离与整个疫情期间的新冠病例及死亡情况。
Arch Public Health. 2025 Mar 25;83(1):80. doi: 10.1186/s13690-025-01563-x.
2
Assessing eco-geographic influences on COVID-19 transmission: a global analysis.评估生态地理因素对 COVID-19 传播的影响:一项全球分析。
Sci Rep. 2024 May 22;14(1):11728. doi: 10.1038/s41598-024-62300-y.
3
Conditioning factors in the spreading of Covid-19 - Does geography matter?

本文引用的文献

1
The Epidemiological Characteristics of an Outbreak of 2019 Novel Coronavirus Diseases (COVID-19) - China, 2020.2019新型冠状病毒病(COVID-19)疫情的流行病学特征 - 中国,2020年
China CDC Wkly. 2020 Feb 21;2(8):113-122.
2
Application of Geographic Information System in Monitoring and Detecting the COVID-19 Outbreak.地理信息系统在监测和检测新冠疫情中的应用
Iran J Public Health. 2020 Oct;49(Suppl 1):114-116. doi: 10.18502/ijph.v49iS1.3679.
3
Epidemiological and clinical features of 2019 novel coronavirus diseases (COVID-19) in the South of Iran.
新冠病毒传播中的调节因素——地理位置重要吗?
Heliyon. 2024 Feb 3;10(3):e25810. doi: 10.1016/j.heliyon.2024.e25810. eCollection 2024 Feb 15.
4
Cost-benefit analysis of Intensive Care Unit with Activity-Based Costing approach in the era COVID-19 pandemic: A case study from Iran.COVID-19 大流行时代采用作业成本法对重症监护病房的成本效益分析:来自伊朗的案例研究。
PLoS One. 2023 May 16;18(5):e0285792. doi: 10.1371/journal.pone.0285792. eCollection 2023.
5
The COVID-19 Mortality Rate Is Associated with Illiteracy, Age, and Air Pollution in Urban Neighborhoods: A Spatiotemporal Cross-Sectional Analysis.新冠病毒疾病死亡率与城市社区的文盲率、年龄及空气污染相关:一项时空横断面分析
Trop Med Infect Dis. 2023 Jan 26;8(2):85. doi: 10.3390/tropicalmed8020085.
6
Modelling Impact of High-Rise, High-Density Built Environment on COVID-19 Risks: Empirical Results from a Case Study of Two Chinese Cities.模拟高层高密度建筑环境对 COVID-19 风险的影响:来自两个中国城市案例研究的实证结果。
Int J Environ Res Public Health. 2023 Jan 12;20(2):1422. doi: 10.3390/ijerph20021422.
7
Effects of the built environment and human factors on the spread of COVID-19: A systematic literature review.建筑环境和人为因素对 COVID-19 传播的影响:系统文献综述。
Sci Total Environ. 2022 Dec 1;850:158056. doi: 10.1016/j.scitotenv.2022.158056. Epub 2022 Aug 17.
8
Methods Used in the Spatial and Spatiotemporal Analysis of COVID-19 Epidemiology: A Systematic Review.用于 COVID-19 流行病学的空间和时空分析的方法:系统评价。
Int J Environ Res Public Health. 2022 Jul 6;19(14):8267. doi: 10.3390/ijerph19148267.
9
Spatiotemporal pattern of Covid-19 outbreak in Turkey.土耳其新冠疫情的时空模式。
GeoJournal. 2023;88(2):1305-1316. doi: 10.1007/s10708-022-10666-9. Epub 2022 Jun 16.
10
Factors that most expose countries to COVID-19: a composite indicators-based approach.使各国最易受新冠病毒影响的因素:一种基于综合指标的方法。
GeoJournal. 2022;87(6):5435-5449. doi: 10.1007/s10708-021-10557-5. Epub 2021 Dec 2.
伊朗南部2019新型冠状病毒病(COVID-19)的流行病学和临床特征
BMC Infect Dis. 2020 Jun 18;20(1):427. doi: 10.1186/s12879-020-05128-x.
4
The powerful immune system against powerful COVID-19: A hypothesis.强大的免疫系统对抗强大的 COVID-19:一个假设。
Med Hypotheses. 2020 Jul;140:109762. doi: 10.1016/j.mehy.2020.109762. Epub 2020 Apr 22.
5
COVID-19 challenges to Pakistan: Is GIS analysis useful to draw solutions?巴基斯坦面临的 COVID-19 挑战:GIS 分析是否有助于寻找解决方案?
Sci Total Environ. 2020 Aug 15;730:139089. doi: 10.1016/j.scitotenv.2020.139089. Epub 2020 May 1.
6
Investigation of effective climatology parameters on COVID-19 outbreak in Iran.调查伊朗 COVID-19 疫情的有效气候学参数。
Sci Total Environ. 2020 Aug 10;729:138705. doi: 10.1016/j.scitotenv.2020.138705. Epub 2020 Apr 17.
7
Epidemiological characteristics of coronavirus disease 2019 (COVID-19) patients in IRAN: A single center study.伊朗 2019 冠状病毒病(COVID-19)患者的流行病学特征:一项单中心研究。
J Clin Virol. 2020 Jun;127:104378. doi: 10.1016/j.jcv.2020.104378. Epub 2020 Apr 21.
8
GIS-based spatial modeling of COVID-19 incidence rate in the continental United States.基于 GIS 的美国大陆 COVID-19 发病率空间建模。
Sci Total Environ. 2020 Aug 1;728:138884. doi: 10.1016/j.scitotenv.2020.138884. Epub 2020 Apr 22.
9
Which Melbourne Metropolitan Areas Are Vulnerable to COVID-19 Based on Age, Disability, and Access to Health Services? Using Spatial Analysis to Identify Service Gaps and Inform Delivery.基于年龄、残疾和获得卫生服务的情况,哪些墨尔本都会区容易受到 COVID-19 的影响?利用空间分析来发现服务差距并为服务提供提供信息。
J Pain Symptom Manage. 2020 Jul;60(1):e41-e44. doi: 10.1016/j.jpainsymman.2020.03.041. Epub 2020 Apr 8.
10
Novel Coronavirus in Cape Town Informal Settlements: Feasibility of Using Informal Dwelling Outlines to Identify High Risk Areas for COVID-19 Transmission From A Social Distancing Perspective.新型冠状病毒在开普敦非正式住区的传播:从社交隔离的角度来看,利用非正式住区轮廓来确定高风险新冠病毒传播区域的可行性。
JMIR Public Health Surveill. 2020 Apr 6;6(2):e18844. doi: 10.2196/18844.