• 文献检索
  • 文档翻译
  • 深度研究
  • 学术资讯
  • Suppr Zotero 插件Zotero 插件
  • 邀请有礼
  • 套餐&价格
  • 历史记录
应用&插件
Suppr Zotero 插件Zotero 插件浏览器插件Mac 客户端Windows 客户端微信小程序
定价
高级版会员购买积分包购买API积分包
服务
文献检索文档翻译深度研究API 文档MCP 服务
关于我们
关于 Suppr公司介绍联系我们用户协议隐私条款
关注我们

Suppr 超能文献

核心技术专利:CN118964589B侵权必究
粤ICP备2023148730 号-1Suppr @ 2026

文献检索

告别复杂PubMed语法,用中文像聊天一样搜索,搜遍4000万医学文献。AI智能推荐,让科研检索更轻松。

立即免费搜索

文件翻译

保留排版,准确专业,支持PDF/Word/PPT等文件格式,支持 12+语言互译。

免费翻译文档

深度研究

AI帮你快速写综述,25分钟生成高质量综述,智能提取关键信息,辅助科研写作。

立即免费体验

Covid-19 死亡率的动态变化和健康的社会决定因素:超越概率的时空分析。

Dynamics of Covid-19 mortality and social determinants of health: a spatiotemporal analysis of exceedance probabilities.

机构信息

Department of Public Health Sciences, the University of North Carolina at Charlotte, 9201 University City Blvd, NC.

Department of Public Health Sciences, the University of North Carolina at Charlotte, 9201 University City Blvd, NC.

出版信息

Ann Epidemiol. 2021 Oct;62:51-58. doi: 10.1016/j.annepidem.2021.05.006. Epub 2021 May 25.

DOI:10.1016/j.annepidem.2021.05.006
PMID:34048904
原文链接:https://pmc.ncbi.nlm.nih.gov/articles/PMC8451980/
Abstract

PURPOSE

To determine the association of social factors with Covid-19 mortality and identify high-risk clusters.

METHODS

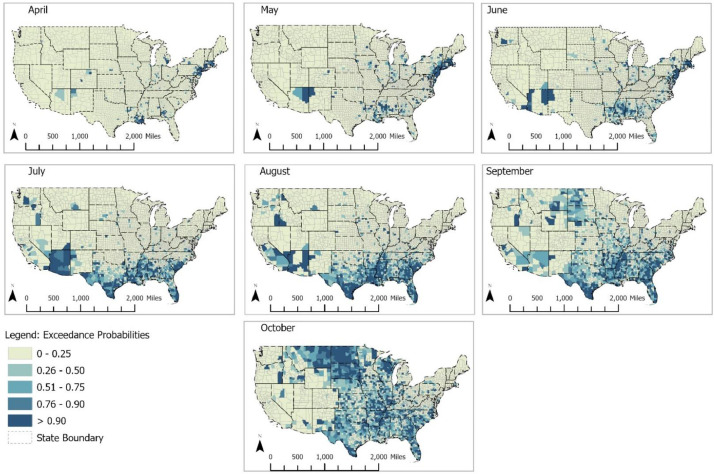
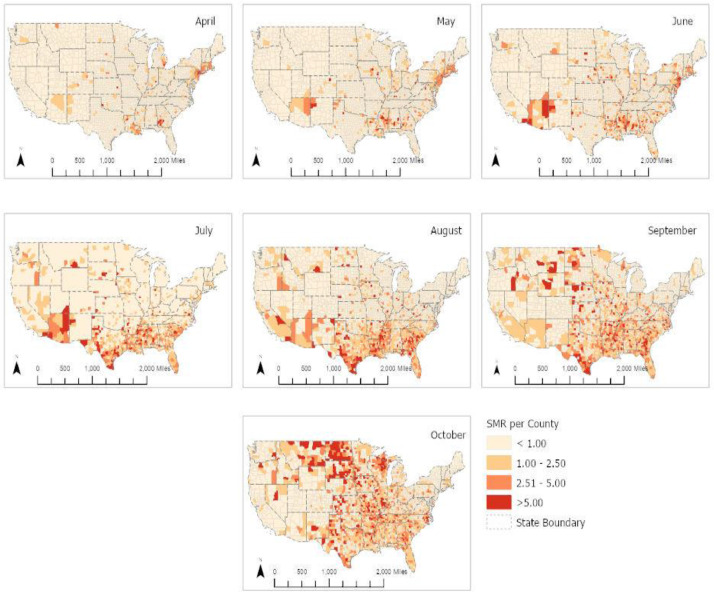
Data on Covid-19 deaths across 3,108 contiguous U.S. counties from the Johns Hopkins University and social determinants of health (SDoH) data from the County Health Ranking and the Bureau of Labor Statistics were fitted to Bayesian semi-parametric spatiotemporal Negative Binomial models, and 95% credible intervals (CrI) of incidence rate ratios (IRR) were used to assess the associations. Exceedance probabilities were used for detecting clusters.

RESULTS

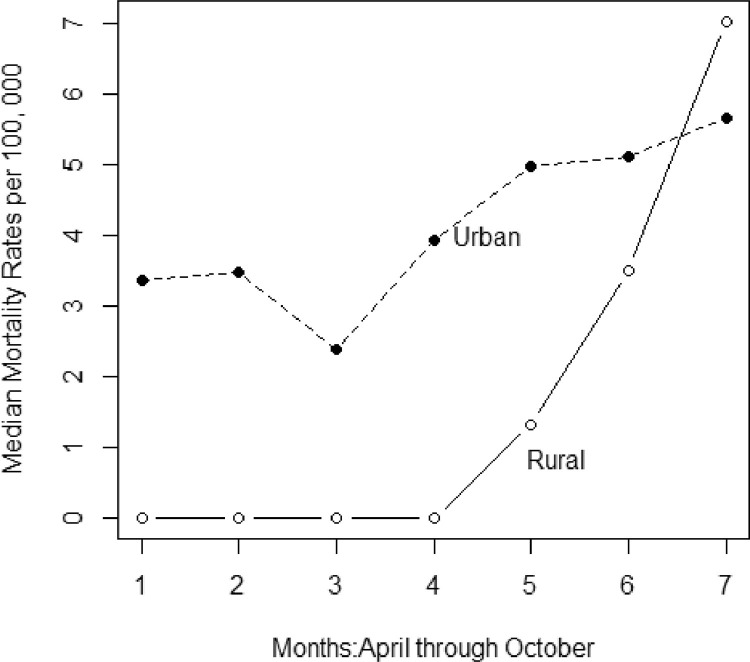
As of October 31, 2020, the median mortality rate was 40.05 per 100, 000. The monthly urban mortality rates increased with unemployment (IRR:1.41, 95% CrI: 1.24, 1.60), percent Black population (IRR:1.05, 95% CrI: 1.04, 1.07), and residential segregation (IRR:1.03, 95% CrI: 1.02, 1.04). The rural monthly mortality rates increased with percent female population (IRR: 1.17, 95% CrI: 1.11, 1.24) and percent Black population (IRR:1.07 95% CrI:1.06, 1.08). Higher college education rates were associated with decreased mortality rates in rural and urban counties. The dynamics of exceedance probabilities detected the shifts of high-risk clusters from the Northeast to Southern and Midwestern counties.

CONCLUSIONS

Spatiotemporal analyses enabled the inclusion of unobserved latent risk factors and aid in scientifically grounded decision-making at a granular level.

摘要

目的

确定社会因素与新冠死亡率之间的关联,并确定高风险聚集区。

方法

从约翰霍普金斯大学(Johns Hopkins University)获取了美国 3108 个连续县的新冠死亡数据,以及县健康排名(County Health Ranking)和劳工统计局(Bureau of Labor Statistics)的健康决定因素数据,利用贝叶斯半参数时空负二项模型进行拟合,使用发病率比(IRR)的 95%可信区间(CrI)来评估关联。利用超越概率来检测集群。

结果

截至 2020 年 10 月 31 日,死亡率中位数为每 10 万人 40.05 人。城市月死亡率随失业率(IRR:1.41,95%CrI:1.24,1.60)、黑人人口比例(IRR:1.05,95%CrI:1.04,1.07)和居住隔离(IRR:1.03,95%CrI:1.02,1.04)而增加。农村月死亡率随女性人口比例(IRR:1.17,95%CrI:1.11,1.24)和黑人人口比例(IRR:1.07,95%CrI:1.06,1.08)而增加。较高的大学教育率与农村和城市县的死亡率降低有关。超越概率的动态变化检测到高危集群从东北部转移到南部和中西部县。

结论

时空分析能够纳入未观察到的潜在风险因素,并有助于在微观层面上进行基于科学的决策。

https://cdn.ncbi.nlm.nih.gov/pmc/blobs/9556/8451980/a197d69cab01/gr3_lrg.jpg
https://cdn.ncbi.nlm.nih.gov/pmc/blobs/9556/8451980/6c89eced26b5/gr1_lrg.jpg
https://cdn.ncbi.nlm.nih.gov/pmc/blobs/9556/8451980/ba3306d941bd/gr2_lrg.jpg
https://cdn.ncbi.nlm.nih.gov/pmc/blobs/9556/8451980/a197d69cab01/gr3_lrg.jpg
https://cdn.ncbi.nlm.nih.gov/pmc/blobs/9556/8451980/6c89eced26b5/gr1_lrg.jpg
https://cdn.ncbi.nlm.nih.gov/pmc/blobs/9556/8451980/ba3306d941bd/gr2_lrg.jpg
https://cdn.ncbi.nlm.nih.gov/pmc/blobs/9556/8451980/a197d69cab01/gr3_lrg.jpg

相似文献

1
Dynamics of Covid-19 mortality and social determinants of health: a spatiotemporal analysis of exceedance probabilities.Covid-19 死亡率的动态变化和健康的社会决定因素:超越概率的时空分析。
Ann Epidemiol. 2021 Oct;62:51-58. doi: 10.1016/j.annepidem.2021.05.006. Epub 2021 May 25.
2
The Association of Social Determinants of Health With COVID-19 Mortality in Rural and Urban Counties.健康社会决定因素与农村和城市县 COVID-19 死亡率的关联。
J Rural Health. 2021 Mar;37(2):278-286. doi: 10.1111/jrh.12557. Epub 2021 Feb 22.
3
Progression of COVID-19 From Urban to Rural Areas in the United States: A Spatiotemporal Analysis of Prevalence Rates.美国新冠病毒从城市向农村地区的传播:流行率的时空分析。
J Rural Health. 2020 Sep;36(4):591-601. doi: 10.1111/jrh.12486. Epub 2020 Jun 30.
4
Assessment of Structural Barriers and Racial Group Disparities of COVID-19 Mortality With Spatial Analysis.利用空间分析评估 COVID-19 死亡率的结构性障碍和种族群体差异。
JAMA Netw Open. 2022 Mar 1;5(3):e220984. doi: 10.1001/jamanetworkopen.2022.0984.
5
Longitudinal disparities in social determinants of health and COVID-19 incidence and mortality in the United States from the three largest waves of the pandemic.美国三大波疫情期间健康社会决定因素与 COVID-19 发病率和死亡率的纵向差异。
Spat Spatiotemporal Epidemiol. 2023 Aug;46:100604. doi: 10.1016/j.sste.2023.100604. Epub 2023 Jul 17.
6
Census Tract Patterns and Contextual Social Determinants of Health Associated With COVID-19 in a Hispanic Population From South Texas: A Spatiotemporal Perspective.从德克萨斯州南部的西班牙裔人群来看,与 COVID-19 相关的人口普查区模式和背景社会决定因素:时空透视。
JMIR Public Health Surveill. 2021 Aug 5;7(8):e29205. doi: 10.2196/29205.
7
Social Determinants of Mortality of COVID-19 and Opioid Overdose in American Rural and Urban Counties.美国农村和城市县 COVID-19 死亡率和阿片类药物过量的社会决定因素。
J Addict Med. 2022;16(1):e52-e55. doi: 10.1097/ADM.0000000000000834.
8
Association of Tropical Cyclones With County-Level Mortality in the US.热带气旋与美国县级死亡率的关联。
JAMA. 2022 Mar 8;327(10):946-955. doi: 10.1001/jama.2022.1682.
9
Clinical, social, and policy factors in COVID-19 cases and deaths: methodological considerations for feature selection and modeling in county-level analyses.新冠肺炎病例和死亡的临床、社会和政策因素:县级分析中特征选择和建模的方法学考虑。
BMC Public Health. 2022 Apr 14;22(1):747. doi: 10.1186/s12889-022-13168-y.
10
The Relationship Between Social Determinants of Health and Racial Disparities in COVID-19 Mortality.健康社会决定因素与 COVID-19 死亡率中的种族差异之间的关系。
J Racial Ethn Health Disparities. 2022 Feb;9(1):288-295. doi: 10.1007/s40615-020-00952-y. Epub 2021 Jan 5.

引用本文的文献

1
Dir-GLM: A Bayesian GLM With Data-Driven Reference Distribution.Dir-GLM:一种具有数据驱动参考分布的贝叶斯广义线性模型。
Stat Med. 2025 Feb 28;44(5):e10305. doi: 10.1002/sim.10305.
2
Urban and Rural Disparities in COVID-19 Outcomes in the United States: A Systematic Review.美国新冠肺炎疫情结果中的城乡差异:一项系统综述
Med Care Res Rev. 2025 Apr;82(2):119-136. doi: 10.1177/10775587241298566. Epub 2024 Dec 10.
3
Editorial: Macroeconomic impact of disease dynamics: a temporal-spatial analysis.社论:疾病动态的宏观经济影响:时空分析

本文引用的文献

1
Spatial and temporal trends in social vulnerability and COVID-19 incidence and death rates in the United States.美国社会脆弱性与 COVID-19 发病率和死亡率的时空趋势。
PLoS One. 2021 Mar 24;16(3):e0248702. doi: 10.1371/journal.pone.0248702. eCollection 2021.
2
The Association of Social Determinants of Health With COVID-19 Mortality in Rural and Urban Counties.健康社会决定因素与农村和城市县 COVID-19 死亡率的关联。
J Rural Health. 2021 Mar;37(2):278-286. doi: 10.1111/jrh.12557. Epub 2021 Feb 22.
3
The Impact of Policy Measures on Human Mobility, COVID-19 Cases, and Mortality in the US: A Spatiotemporal Perspective.
Front Public Health. 2024 Sep 3;12:1473761. doi: 10.3389/fpubh.2024.1473761. eCollection 2024.
4
Bayesian spatio-temporal analysis of the COVID-19 pandemic in Catalonia.贝叶斯时空分析加泰罗尼亚的 COVID-19 疫情。
Sci Rep. 2024 Feb 20;14(1):4220. doi: 10.1038/s41598-024-53527-w.
5
Inequality in COVID-19 mortality in Quebec associated with neighbourhood-level vulnerability domains.魁北克 COVID-19 死亡率的不平等与社区脆弱性领域有关。
Can J Public Health. 2024 Feb;115(1):53-66. doi: 10.17269/s41997-023-00829-7. Epub 2023 Dec 15.
6
Simulating and Forecasting the COVID-19 Spread in a U.S. Metropolitan Region with a Spatial SEIR Model.用空间 SEIR 模型模拟和预测美国大都市区的 COVID-19 传播。
Int J Environ Res Public Health. 2022 Nov 27;19(23):15771. doi: 10.3390/ijerph192315771.
7
Temporal Dynamics of Socioeconomic Inequalities in COVID-19 Outcomes Over the Course of the Pandemic-A Scoping Review.大流行期间 COVID-19 结局的社会经济不平等的时间动态:范围综述。
Int J Public Health. 2022 Aug 29;67:1605128. doi: 10.3389/ijph.2022.1605128. eCollection 2022.
8
Methods Used in the Spatial and Spatiotemporal Analysis of COVID-19 Epidemiology: A Systematic Review.用于 COVID-19 流行病学的空间和时空分析的方法:系统评价。
Int J Environ Res Public Health. 2022 Jul 6;19(14):8267. doi: 10.3390/ijerph19148267.
9
Moving the needle on health inequities: principles and tactics for effective cross-sector population health networks.推动健康不平等问题的解决:有效跨部门人口健康网络的原则和策略。
Curr Opin Pediatr. 2022 Feb 1;34(1):27-32. doi: 10.1097/MOP.0000000000001085.
政策措施对美国人口流动、新冠病例和死亡率的影响:时空透视。
Int J Environ Res Public Health. 2021 Jan 23;18(3):996. doi: 10.3390/ijerph18030996.
4
Social Determinants of Health and Health Disparities: COVID-19 Exposures and Mortality Among African American People in the United States.健康的社会决定因素与健康差距:美国非裔人群中的新冠病毒暴露与死亡率
Public Health Rep. 2021 Jan/Feb;136(1):18-22. doi: 10.1177/0033354920969169. Epub 2020 Nov 11.
5
Health Disparities in COVID-19: Addressing the Role of Social Determinants of Health in Immune System Dysfunction to Turn the Tide.2019冠状病毒病中的健康差异:应对健康的社会决定因素在免疫系统功能障碍中的作用以扭转局势。
Front Public Health. 2020 Oct 8;8:559312. doi: 10.3389/fpubh.2020.559312. eCollection 2020.
6
Social determinants of COVID-19 mortality at the county level.县级层面下 COVID-19 死亡率的社会决定因素。
PLoS One. 2020 Oct 14;15(10):e0240151. doi: 10.1371/journal.pone.0240151. eCollection 2020.
7
The role of Frailty on Adverse Outcomes Among Older Patients with COVID-19.衰弱在 COVID-19 老年患者不良结局中的作用。
J Infect. 2020 Dec;81(6):944-951. doi: 10.1016/j.jinf.2020.09.029. Epub 2020 Sep 28.
8
Association of cardiovascular disease and 10 other pre-existing comorbidities with COVID-19 mortality: A systematic review and meta-analysis.心血管疾病与其他 10 种预先存在的合并症与 COVID-19 死亡率的关联:系统评价和荟萃分析。
PLoS One. 2020 Aug 26;15(8):e0238215. doi: 10.1371/journal.pone.0238215. eCollection 2020.
9
Black/African American Communities are at highest risk of COVID-19: spatial modeling of New York City ZIP Code-level testing results.黑人和非裔美国人社区面临着最高的 COVID-19 风险:纽约市邮政编码级检测结果的空间建模。
Ann Epidemiol. 2020 Nov;51:7-13. doi: 10.1016/j.annepidem.2020.08.012. Epub 2020 Aug 20.
10
Spatial analysis of COVID-19 clusters and contextual factors in New York City.纽约市新冠疫情聚集性病例及相关背景因素的空间分析
Spat Spatiotemporal Epidemiol. 2020 Aug;34:100355. doi: 10.1016/j.sste.2020.100355. Epub 2020 Jun 21.