• 文献检索
  • 文档翻译
  • 深度研究
  • 学术资讯
  • Suppr Zotero 插件Zotero 插件
  • 邀请有礼
  • 套餐&价格
  • 历史记录
应用&插件
Suppr Zotero 插件Zotero 插件浏览器插件Mac 客户端Windows 客户端微信小程序
定价
高级版会员购买积分包购买API积分包
服务
文献检索文档翻译深度研究API 文档MCP 服务
关于我们
关于 Suppr公司介绍联系我们用户协议隐私条款
关注我们

Suppr 超能文献

核心技术专利:CN118964589B侵权必究
粤ICP备2023148730 号-1Suppr @ 2026

文献检索

告别复杂PubMed语法,用中文像聊天一样搜索,搜遍4000万医学文献。AI智能推荐,让科研检索更轻松。

立即免费搜索

文件翻译

保留排版,准确专业,支持PDF/Word/PPT等文件格式,支持 12+语言互译。

免费翻译文档

深度研究

AI帮你快速写综述,25分钟生成高质量综述,智能提取关键信息,辅助科研写作。

立即免费体验

西班牙死亡率的贝叶斯时空分析:在 2020 年 COVID-19 爆发中的应用。

A Bayesian spatio-temporal analysis of mortality rates in Spain: application to the COVID-19 2020 outbreak.

机构信息

Department of Mathematics, University of Las Palmas de Gran Canaria, Las Palmas, Spain.

Department of Physical Education and Biomedical and Health Research Universitary Institute, University of Las Palmas de Gran Canaria, Las Palmas, Spain.

出版信息

Popul Health Metr. 2021 May 31;19(1):27. doi: 10.1186/s12963-021-00259-y.

DOI:10.1186/s12963-021-00259-y
PMID:34059063
原文链接:https://pmc.ncbi.nlm.nih.gov/articles/PMC8165954/
Abstract

BACKGROUND

The number of deaths attributable to COVID-19 in Spain has been highly controversial since it is problematic to tell apart deaths having COVID as the main cause from those provoked by the aggravation by the viral infection of other underlying health problems. In addition, overburdening of health system led to an increase in mortality due to the scarcity of adequate medical care, at the same time confinement measures could have contributed to the decrease in mortality from certain causes. Our aim is to compare the number of deaths observed in 2020 with the projection for the same period obtained from a sequence of previous years. Thus, this computed mortality excess could be considered as the real impact of the COVID-19 on the mortality rates.

METHODS

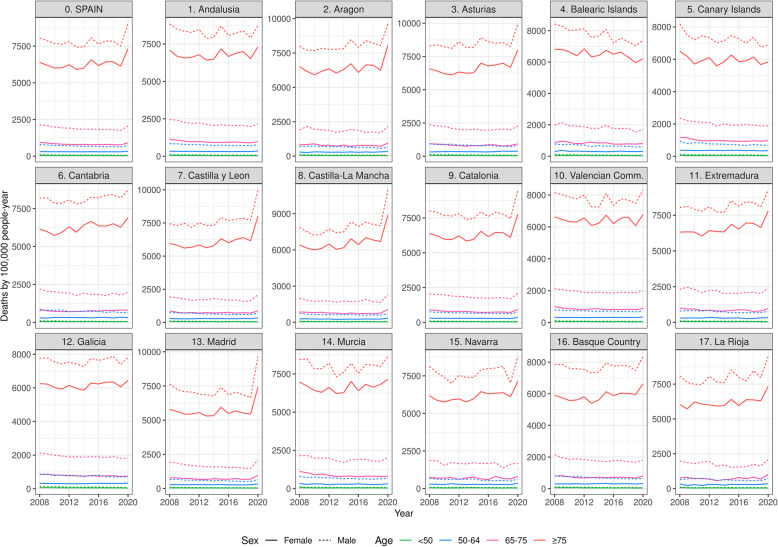
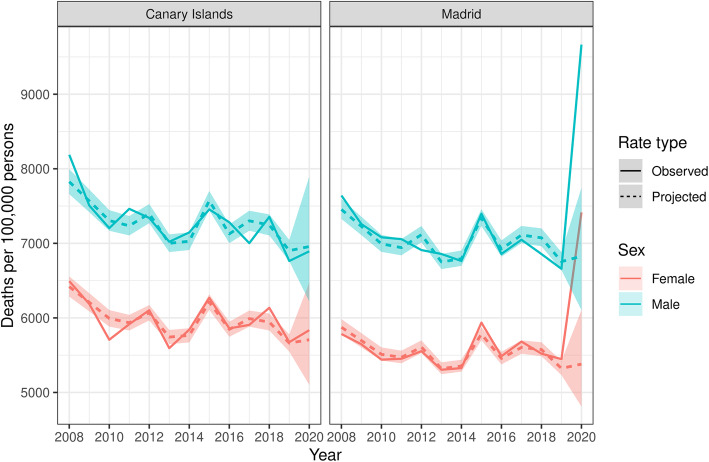
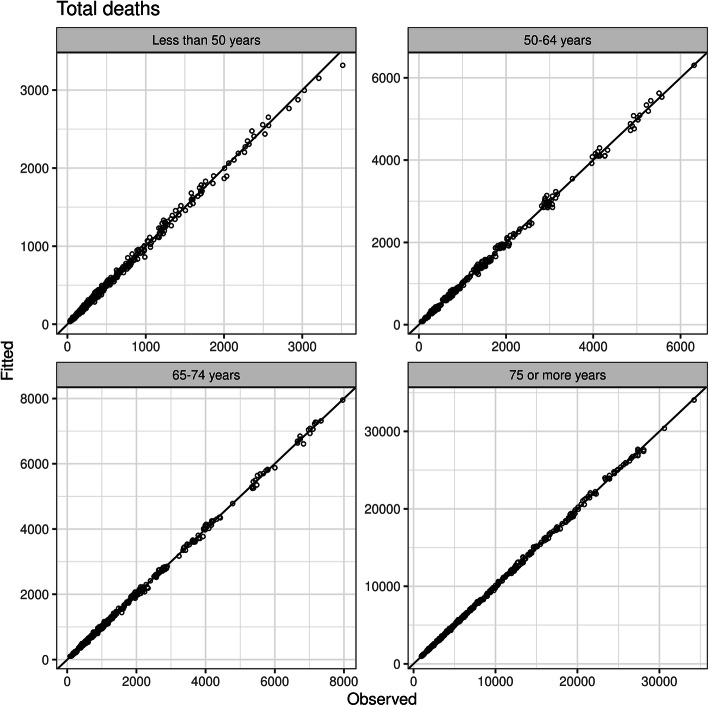
The population was split into four age groups, namely: (< 50; 50-64; 65-74; 75 and over). For each one, a projection of the death numbers for the year 2020, based on the interval 2008-2020, was estimated using a Bayesian spatio-temporal model. In each one, spatial, sex, and year effects were included. In addition, a specific effect of the year 2020 was added ("outbreak"). Finally, the excess deaths in year 2020 were estimated as the count of observed deaths minus those projected.

RESULTS

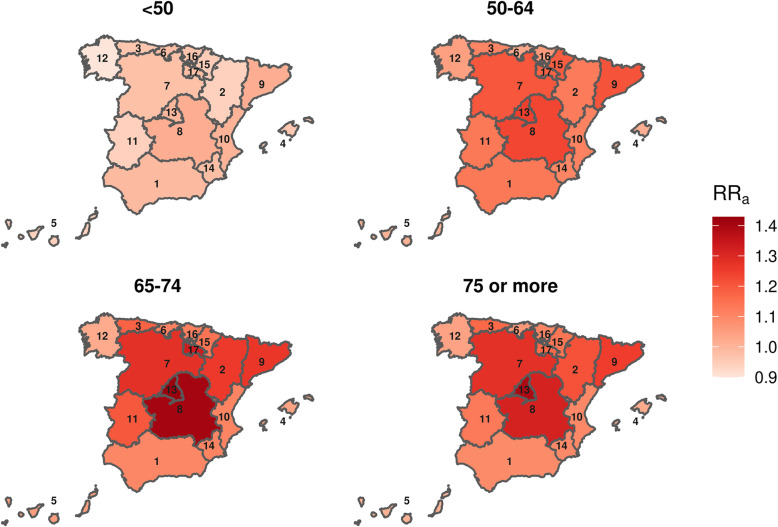
The projected death number for 2020 was 426,970 people, the actual count being 499,104; thus, the total excess of deaths was 72,134. However, this increase was very unequally distributed over the Spanish regions.

CONCLUSION

Bayesian spatio-temporal models have proved to be a useful tool for estimating the impact of COVID-19 on mortality in Spain in 2020, making it possible to assess how the disease has affected different age groups accounting for effects of sex, spatial variation between regions and time trend over the last few years.

摘要

背景

自新冠疫情爆发以来,西班牙因新冠病毒死亡的人数一直存在争议,因为很难区分因新冠病毒而直接导致的死亡和因新冠病毒恶化而导致的其他潜在健康问题引发的死亡。此外,医疗系统负担过重导致因医疗资源不足而导致的死亡率上升,同时,封锁措施可能导致某些原因导致的死亡率下降。我们的目的是将 2020 年观察到的死亡人数与同年的预测数据进行比较,从而得出新冠疫情对死亡率的实际影响。

方法

将人群分为四个年龄组,分别为:(<50 岁;50-64 岁;65-74 岁;75 岁及以上)。对于每个年龄组,根据 2008-2020 年的时间段,使用贝叶斯时空模型对 2020 年的死亡人数进行预测。在每个模型中,都包括了空间、性别和年份的影响。此外,还添加了 2020 年的特定影响(“疫情爆发”)。最后,通过观察到的死亡人数减去预测的死亡人数来计算 2020 年的超额死亡人数。

结果

2020 年预测的死亡人数为 426970 人,实际死亡人数为 499104 人,因此总死亡人数增加了 72134 人。然而,这种增加在西班牙各地区的分布非常不均衡。

结论

贝叶斯时空模型已被证明是一种有用的工具,可用于估计 2020 年新冠疫情对西班牙死亡率的影响,从而评估该疾病如何影响不同年龄组,同时考虑了性别、地区间的空间差异和过去几年的时间趋势。

https://cdn.ncbi.nlm.nih.gov/pmc/blobs/d2f6/8167941/b7d21563d66a/12963_2021_259_Fig4_HTML.jpg
https://cdn.ncbi.nlm.nih.gov/pmc/blobs/d2f6/8167941/cc46a62be371/12963_2021_259_Fig1_HTML.jpg
https://cdn.ncbi.nlm.nih.gov/pmc/blobs/d2f6/8167941/14c67147417d/12963_2021_259_Fig2_HTML.jpg
https://cdn.ncbi.nlm.nih.gov/pmc/blobs/d2f6/8167941/8ed39c2b9bac/12963_2021_259_Fig3_HTML.jpg
https://cdn.ncbi.nlm.nih.gov/pmc/blobs/d2f6/8167941/b7d21563d66a/12963_2021_259_Fig4_HTML.jpg

相似文献

1
A Bayesian spatio-temporal analysis of mortality rates in Spain: application to the COVID-19 2020 outbreak.西班牙死亡率的贝叶斯时空分析:在 2020 年 COVID-19 爆发中的应用。
Popul Health Metr. 2021 May 31;19(1):27. doi: 10.1186/s12963-021-00259-y.
2
A municipality-level analysis of excess mortality in Italy in the period January-April 2020.2020 年 1 月至 4 月期间意大利各市级行政单位超额死亡率分析。
Epidemiol Prev. 2020 Sep-Dec;44(5-6 Suppl 2):297-306. doi: 10.19191/EP20.5-6.S2.130.
3
Assessment of the Overall Mortality during the COVID-19 Outbreak in the Provinces of Milan and Lodi (Lombardy Region, Northern Italy).评估意大利北部伦巴第大区米兰省和洛迪省(Lodi)在 COVID-19 疫情爆发期间的总体死亡率。
Epidemiol Prev. 2020 Sep-Dec;44(5-6 Suppl 2):244-251. doi: 10.19191/EP20.5-6.S2.124.
4
Excess mortality during the COVID-19 outbreak in Italy: a two-stage interrupted time-series analysis.意大利 COVID-19 疫情期间的超额死亡率:两阶段中断时间序列分析。
Int J Epidemiol. 2021 Jan 23;49(6):1909-1917. doi: 10.1093/ije/dyaa169.
5
Measuring the impact of the COVID-19 outbreak in Ecuador using preliminary estimates of excess mortality, March 17-October 22, 2020.利用 2020 年 3 月 17 日至 10 月 22 日的超额死亡率初步估计来衡量厄瓜多尔 COVID-19 疫情的影响。
Int J Infect Dis. 2021 Mar;104:297-299. doi: 10.1016/j.ijid.2020.12.045. Epub 2020 Dec 19.
6
[Temporal variations in excess mortality during phase 1 and phase 2 of the COVID-19 epidemic in Italy].[意大利新冠肺炎疫情第一阶段和第二阶段期间超额死亡率的时间变化]
Epidemiol Prev. 2020 Sep-Dec;44(5-6 Suppl 2):236-243. doi: 10.19191/EP20.5-6.S2.123.
7
Comparing the COVID-19 pandemic in space and over time in Europe, using numbers of deaths, crude rates and adjusted mortality trend ratios.比较欧洲在不同时期和空间下的 COVID-19 疫情,使用死亡人数、粗死亡率和调整后的死亡率趋势比。
Sci Rep. 2021 Aug 12;11(1):16443. doi: 10.1038/s41598-021-95658-4.
8
Regional excess mortality during the 2020 COVID-19 pandemic in five European countries.2020 年 COVID-19 大流行期间五个欧洲国家的区域超额死亡率。
Nat Commun. 2022 Jan 25;13(1):482. doi: 10.1038/s41467-022-28157-3.
9
[Sex/gender differences in COVID-19 lethality: what the data say, and do not say].[新冠病毒病致死率中的性别差异:数据所表明及未表明的情况]
Epidemiol Prev. 2020 Sep-Dec;44(5-6 Suppl 2):400-406. doi: 10.19191/EP20.5-6.S2.145.
10
Temporal dynamic in the impact of COVID- 19 outbreak on cause-specific mortality in Guangzhou, China.新冠疫情对中国广州特定病因死亡率影响的时间动态变化。
BMC Public Health. 2021 May 8;21(1):883. doi: 10.1186/s12889-021-10771-3.

引用本文的文献

1
Three-year survival follow-up of patients with gastrointestinal cancer treated during the COVID-19 pandemic in Spain: data from the PANDORA-TTD20 study.西班牙COVID-19大流行期间接受治疗的胃肠道癌患者的三年生存随访:来自PANDORA-TTD20研究的数据。
Oncologist. 2024 Nov 16. doi: 10.1093/oncolo/oyae300.
2
Democratic quality and excess mortality during the COVID-19 pandemic.新冠大流行期间的民主质量与超额死亡率。
Sci Rep. 2024 Apr 4;14(1):7948. doi: 10.1038/s41598-024-55523-6.
3
A Novel Bayesian Spatial-Temporal Approach to Quantify SARS-CoV-2 Testing Disparities for Small Area Estimation.

本文引用的文献

1
Geospatial and temporal variation of prostate cancer incidence.前列腺癌发病率的时空变化。
Public Health. 2021 Jan;190:7-15. doi: 10.1016/j.puhe.2020.10.032. Epub 2020 Dec 13.
2
Coronavirus disease 2019 and gender-related mortality in European countries: A meta-analysis.2019 年冠状病毒病与欧洲国家的性别相关死亡率:一项荟萃分析。
Maturitas. 2020 Nov;141:59-62. doi: 10.1016/j.maturitas.2020.06.017. Epub 2020 Jun 23.
3
National all-cause mortality during the COVID-19 pandemic: a Danish registry-based study.新冠大流行期间的全国全因死亡率:一项丹麦基于登记的研究。
一种用于定量估计 SARS-CoV-2 检测差异的新型贝叶斯时空方法。
Am J Public Health. 2023 Jan;113(1):40-48. doi: 10.2105/AJPH.2022.307127.
4
COVID-19 Secondary Infections in ICU Patients and Prevention Control Measures: A Preliminary Prospective Multicenter Study.ICU患者的新型冠状病毒肺炎继发感染及防控措施:一项初步前瞻性多中心研究
Antibiotics (Basel). 2022 Jul 28;11(8):1016. doi: 10.3390/antibiotics11081016.
5
Identifying spatiotemporal patterns of COVID-19 transmissions and the drivers of the patterns in Toronto: a Bayesian hierarchical spatiotemporal modelling.识别 COVID-19 在多伦多的时空传播模式及其驱动因素:贝叶斯分层时空建模。
Sci Rep. 2022 Jun 7;12(1):9369. doi: 10.1038/s41598-022-13403-x.
6
Heterogeneity in subnational mortality in the context of the COVID-19 pandemic: the case of Belgian districts in 2020.新冠疫情背景下国家以下层面死亡率的异质性:以2020年比利时各地区为例
Arch Public Health. 2022 May 6;80(1):130. doi: 10.1186/s13690-022-00874-7.
Eur J Epidemiol. 2020 Nov;35(11):1007-1019. doi: 10.1007/s10654-020-00680-x. Epub 2020 Sep 21.
4
Excess mortality: the gold standard in measuring the impact of COVID-19 worldwide?超额死亡率:衡量新冠疫情对全球影响的金标准?
J R Soc Med. 2020 Sep;113(9):329-334. doi: 10.1177/0141076820956802.
5
Temporal dynamics in total excess mortality and COVID-19 deaths in Italian cities.意大利城市总超额死亡率和 COVID-19 死亡人数的时间动态。
BMC Public Health. 2020 Aug 14;20(1):1238. doi: 10.1186/s12889-020-09335-8.
6
COVID-19 Clinical Characteristics, and Sex-Specific Risk of Mortality: Systematic Review and Meta-Analysis.COVID-19的临床特征及性别特异性死亡风险:系统评价与荟萃分析
Front Med (Lausanne). 2020 Jul 21;7:459. doi: 10.3389/fmed.2020.00459. eCollection 2020.
7
Longitudinal analyses of the relationship between development density and the COVID-19 morbidity and mortality rates: Early evidence from 1,165 metropolitan counties in the United States.美国 1165 个大都市区 COVID-19 发病率和死亡率与发展密度关系的纵向分析:初步证据。
Health Place. 2020 Jul;64:102378. doi: 10.1016/j.healthplace.2020.102378. Epub 2020 Jun 25.
8
The effect of lockdown on the outcomes of COVID-19 in Spain: An ecological study.封锁对西班牙 COVID-19 结局的影响:一项生态学研究。
PLoS One. 2020 Jul 29;15(7):e0236779. doi: 10.1371/journal.pone.0236779. eCollection 2020.
9
Spatial modeling, risk mapping, change detection, and outbreak trend analysis of coronavirus (COVID-19) in Iran (days between February 19 and June 14, 2020).伊朗2020年2月19日至6月14日期间冠状病毒(COVID-19)的空间建模、风险制图、变化检测及疫情趋势分析
Int J Infect Dis. 2020 Sep;98:90-108. doi: 10.1016/j.ijid.2020.06.058. Epub 2020 Jun 20.
10
Assessing functional propagation patterns in COVID-19.评估新冠病毒病中的功能传播模式。
Chaos Solitons Fractals. 2020 Sep;138:109993. doi: 10.1016/j.chaos.2020.109993. Epub 2020 Jun 12.