• 文献检索
  • 文档翻译
  • 深度研究
  • 学术资讯
  • Suppr Zotero 插件Zotero 插件
  • 邀请有礼
  • 套餐&价格
  • 历史记录
应用&插件
Suppr Zotero 插件Zotero 插件浏览器插件Mac 客户端Windows 客户端微信小程序
定价
高级版会员购买积分包购买API积分包
服务
文献检索文档翻译深度研究API 文档MCP 服务
关于我们
关于 Suppr公司介绍联系我们用户协议隐私条款
关注我们

Suppr 超能文献

核心技术专利:CN118964589B侵权必究
粤ICP备2023148730 号-1Suppr @ 2026

文献检索

告别复杂PubMed语法,用中文像聊天一样搜索,搜遍4000万医学文献。AI智能推荐,让科研检索更轻松。

立即免费搜索

文件翻译

保留排版,准确专业,支持PDF/Word/PPT等文件格式,支持 12+语言互译。

免费翻译文档

深度研究

AI帮你快速写综述,25分钟生成高质量综述,智能提取关键信息,辅助科研写作。

立即免费体验

2012 年、2015 年和 2017 年中国省级多区域投入产出数据库。

Chinese provincial multi-regional input-output database for 2012, 2015, and 2017.

机构信息

Industrial Ecology Programme, Department of Energy and Process Engineering, Norwegian University of Science and Technology, Trondheim, 7491, Norway.

Institute of Blue and Green Development, Shandong University, Weihai, 264209, China.

出版信息

Sci Data. 2021 Sep 22;8(1):244. doi: 10.1038/s41597-021-01023-5.

DOI:10.1038/s41597-021-01023-5
PMID:34552097
原文链接:https://pmc.ncbi.nlm.nih.gov/articles/PMC8458474/
Abstract

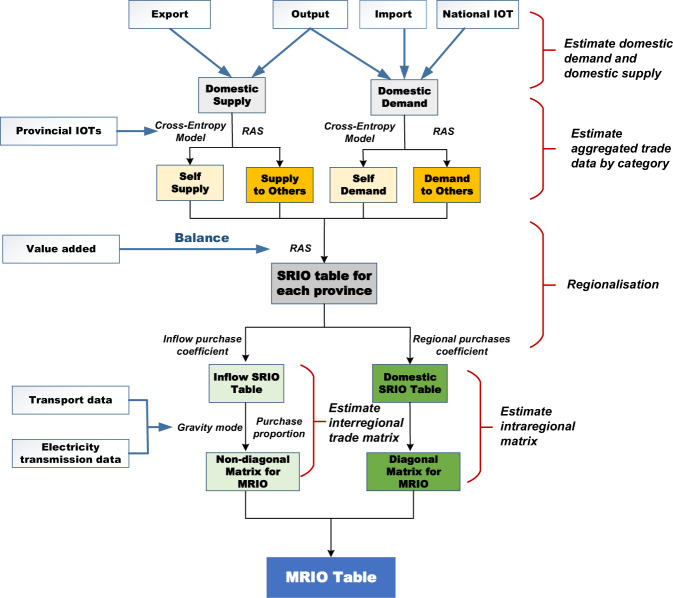
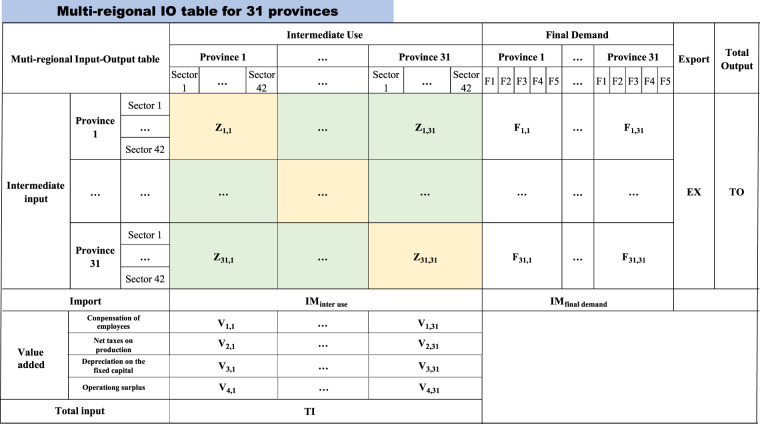
Global production fragmentation generates indirect socioeconomic and environmental impacts throughout its expanded supply chains. The multi-regional input-output model (MRIO) is a tool commonly used to trace the supply chain and understand spillover effects across regions, but often cannot be applied due to data unavailability, especially at the sub-national level. Here, we present MRIO tables for 2012, 2015, and 2017 for 31 provinces of mainland China in 42 economic sectors. We employ hybrid methods to construct the MRIO tables according to the available data for each year. The dataset is the consistent China MRIO table collection to reveal the evolution of regional supply chains in China's recent economic transition. The dataset illustrates the consistent evolution of China's regional supply chain and its economic structure before the 2018 US-Sino trade war. The dataset can be further applied as a benchmark in a wide range of in-depth studies of production and consumption structures across industries and regions.

摘要

全球生产碎片化在其扩展的供应链中产生间接的社会经济和环境影响。多区域投入产出模型 (MRIO) 是一种常用的工具,用于追踪供应链并了解跨区域的溢出效应,但由于数据不可用,尤其是在国家以下层面,通常无法应用。在这里,我们提供了 2012 年、2015 年和 2017 年中国大陆 31 个省、42 个经济部门的 MRIO 表。我们根据每年可用的数据采用混合方法构建 MRIO 表。该数据集是一致的中国投入产出表集合,以揭示中国近期经济转型中区域供应链的演变。该数据集说明了在 2018 年中美贸易战之前,中国区域供应链及其经济结构的一致演变。该数据集可进一步作为基准,应用于广泛的行业和地区生产和消费结构的深入研究。

https://cdn.ncbi.nlm.nih.gov/pmc/blobs/687e/8458474/094e805d04b9/41597_2021_1023_Fig5_HTML.jpg
https://cdn.ncbi.nlm.nih.gov/pmc/blobs/687e/8458474/93c0433e8cf7/41597_2021_1023_Fig1_HTML.jpg
https://cdn.ncbi.nlm.nih.gov/pmc/blobs/687e/8458474/0bb2b4f0fe8c/41597_2021_1023_Fig2_HTML.jpg
https://cdn.ncbi.nlm.nih.gov/pmc/blobs/687e/8458474/c0ccfcb6ded8/41597_2021_1023_Fig3_HTML.jpg
https://cdn.ncbi.nlm.nih.gov/pmc/blobs/687e/8458474/8eb687aace50/41597_2021_1023_Fig4_HTML.jpg
https://cdn.ncbi.nlm.nih.gov/pmc/blobs/687e/8458474/094e805d04b9/41597_2021_1023_Fig5_HTML.jpg

相似文献

1
Chinese provincial multi-regional input-output database for 2012, 2015, and 2017.2012 年、2015 年和 2017 年中国省级多区域投入产出数据库。
Sci Data. 2021 Sep 22;8(1):244. doi: 10.1038/s41597-021-01023-5.
2
A multi-regional input-output table mapping China's economic outputs and interdependencies in 2012.一张中国 2012 年经济产出和相互依存关系的多区域投入产出表。
Sci Data. 2018 Aug 7;5:180155. doi: 10.1038/sdata.2018.155.
3
Guangdong's embodied carbon emission in China's inter-provincial trade based on MRIO model.基于多区域投入产出模型的广东省在中国省际贸易中的隐含碳排放。
Environ Sci Pollut Res Int. 2021 May;28(18):23432-23447. doi: 10.1007/s11356-020-11467-8. Epub 2021 Jan 14.
4
Measuring the environmental sustainability performance of global supply chains: A multi-regional input-output analysis for carbon, sulphur oxide and water footprints.衡量全球供应链的环境可持续性表现:碳、硫氧化物和水足迹的多区域投入产出分析
J Environ Manage. 2017 Feb 1;187:571-585. doi: 10.1016/j.jenvman.2016.10.059. Epub 2016 Nov 18.
5
Global spatio-temporal change assessment in interregional water stress footprint in China by a high resolution MRIO model.基于高分辨率多区域投入产出模型的中国区域间水胁迫足迹的全球时空变化评估。
Sci Total Environ. 2022 Oct 1;841:156682. doi: 10.1016/j.scitotenv.2022.156682. Epub 2022 Jun 13.
6
Research on accounting of provincial carbon transfer: based on the empirical data of 30 provinces in China.省级碳转移核算研究:基于中国30个省份的实证数据
Environ Sci Pollut Res Int. 2022 Jun;29(27):40984-40996. doi: 10.1007/s11356-021-17410-9. Epub 2022 Jan 27.
7
Evaluating Indirect Economic Losses from Flooding Using Input-Output Analysis: An Application to China's Jiangxi Province.利用投入产出分析评估洪水造成的间接经济损失:以中国江西省为例。
Int J Environ Res Public Health. 2023 Mar 3;20(5):4509. doi: 10.3390/ijerph20054509.
8
Estimation of the contribution of exports to the provincial economy: an analysis based on China's multi-regional input-output tables.出口对省级经济贡献的估算:基于中国多区域投入产出表的分析
Springerplus. 2016 Feb 29;5:210. doi: 10.1186/s40064-016-1803-7. eCollection 2016.
9
Tracing the Uncertain Chinese Mercury Footprint within the Global Supply Chain Using a Stochastic, Nested Input-Output Model.采用随机嵌套投入产出模型追踪全球供应链中的不确定中国汞足迹。
Environ Sci Technol. 2019 Jun 18;53(12):6814-6823. doi: 10.1021/acs.est.8b06373. Epub 2019 Jun 4.
10
Embodied Energy Use in China's Transportation Sector: A Multi-Regional Input-Output Analysis.中国交通运输部门的能源消耗:基于多区域投入产出分析。
Int J Environ Res Public Health. 2021 Jul 25;18(15):7873. doi: 10.3390/ijerph18157873.

引用本文的文献

1
A dataset of interprovincial food trade flows in China.中国省际食品贸易流动数据集。
Sci Data. 2025 Jun 5;12(1):943. doi: 10.1038/s41597-025-05290-4.
2
An inter-city input-output database distinguishing firm ownership in the Greater China area during 2002-2017.一个区分2002 - 2017年大中华地区企业所有权的城际投入产出数据库。
Sci Data. 2025 May 1;12(1):723. doi: 10.1038/s41597-025-04996-9.
3
Quantifying the Source-Receptor Relationships of Pollution and Associated Health Impacts among China, South Korea, and Japan: A Dual Perspective and an Interdisciplinary Approach.

本文引用的文献

1
A 2015 inventory of embodied carbon emissions for Chinese power transmission infrastructure projects.2015 年中国输变电基础设施项目隐含碳排放清单。
Sci Data. 2020 Oct 1;7(1):318. doi: 10.1038/s41597-020-00662-4.
2
Improving Subnational Input-Output Analyses Using Regional Trade Data: A Case-Study and Comparison.利用区域贸易数据改进次国家投入产出分析:案例研究与比较。
Environ Sci Technol. 2020 Oct 6;54(19):12732-12741. doi: 10.1021/acs.est.0c04728. Epub 2020 Sep 4.
3
Great Divergence Exists in Chinese Provincial Trade-Related CO Emission Accounts.
量化中国、韩国和日本之间污染的源-受体关系及其相关健康影响:双重视角与跨学科方法
Environ Health Perspect. 2025 Apr;133(3-4):47011. doi: 10.1289/EHP14550. Epub 2025 Apr 25.
4
An inter-regional input-output table series of China from 1987-2017 with integrated carbon emission data.1987 - 2017年中国区域间投入产出表系列及综合碳排放数据
Sci Data. 2024 Dec 18;11(1):1335. doi: 10.1038/s41597-024-04263-3.
5
A high-resolution multi-scale industrial water use dataset in China.中国的一个高分辨率多尺度工业用水数据集。
Sci Data. 2024 Dec 5;11(1):1327. doi: 10.1038/s41597-024-04204-0.
6
Environmental and economic impact analysis of levying VOCs environmental protection tax in China.中国征收挥发性有机物环境保护税的环境与经济影响分析
Heliyon. 2024 Aug 22;10(17):e36738. doi: 10.1016/j.heliyon.2024.e36738. eCollection 2024 Sep 15.
7
Provincial-level analysis of electrification feasibility and climate policy interactions.省级层面的电气化可行性与气候政策互动分析。
Environ Sci Ecotechnol. 2024 Aug 5;22:100474. doi: 10.1016/j.ese.2024.100474. eCollection 2024 Nov.
8
Substantial differences in source contributions to carbon emissions and health damage necessitate balanced synergistic control plans in China.中国碳排放和健康损害的源贡献存在显著差异,因此需要制定平衡的协同控制计划。
Nat Commun. 2024 Jul 13;15(1):5880. doi: 10.1038/s41467-024-50327-8.
9
Health burden from food systems is highly unequal across income groups.各收入组人群因食物系统导致的健康负担存在严重的不平等。
Nat Food. 2024 Mar;5(3):251-261. doi: 10.1038/s43016-024-00946-7. Epub 2024 Mar 14.
10
An interprovincial input-output database distinguishing firm ownership in China from 1997 to 2017.1997 年至 2017 年中国区分企业所有制的省际投入产出数据库。
Sci Data. 2023 May 18;10(1):293. doi: 10.1038/s41597-023-02183-2.
中国省级贸易相关 CO 排放账户存在巨大差异。
Environ Sci Technol. 2020 Jul 21;54(14):8527-8538. doi: 10.1021/acs.est.9b07278. Epub 2020 Jun 26.
4
Structural Changes in Provincial Emission Transfers within China.中国省级排放权交易中的结构变化。
Environ Sci Technol. 2018 Nov 20;52(22):12958-12967. doi: 10.1021/acs.est.8b03424. Epub 2018 Nov 5.
5
A multi-regional input-output table mapping China's economic outputs and interdependencies in 2012.一张中国 2012 年经济产出和相互依存关系的多区域投入产出表。
Sci Data. 2018 Aug 7;5:180155. doi: 10.1038/sdata.2018.155.
6
Chinese CO emission flows have reversed since the global financial crisis.中国的二氧化碳排放量自全球金融危机以来已经出现逆转。
Nat Commun. 2017 Nov 23;8(1):1712. doi: 10.1038/s41467-017-01820-w.