• 文献检索
  • 文档翻译
  • 深度研究
  • 学术资讯
  • Suppr Zotero 插件Zotero 插件
  • 邀请有礼
  • 套餐&价格
  • 历史记录
应用&插件
Suppr Zotero 插件Zotero 插件浏览器插件Mac 客户端Windows 客户端微信小程序
定价
高级版会员购买积分包购买API积分包
服务
文献检索文档翻译深度研究API 文档MCP 服务
关于我们
关于 Suppr公司介绍联系我们用户协议隐私条款
关注我们

Suppr 超能文献

核心技术专利:CN118964589B侵权必究
粤ICP备2023148730 号-1Suppr @ 2026

文献检索

告别复杂PubMed语法,用中文像聊天一样搜索,搜遍4000万医学文献。AI智能推荐,让科研检索更轻松。

立即免费搜索

文件翻译

保留排版,准确专业,支持PDF/Word/PPT等文件格式,支持 12+语言互译。

免费翻译文档

深度研究

AI帮你快速写综述,25分钟生成高质量综述,智能提取关键信息,辅助科研写作。

立即免费体验

卡塔尔多哈市六个社会经济部门在新冠疫情背景下水电消耗的时空分析。

Spatiotemporal analysis of water-electricity consumption in the context of the COVID-19 pandemic across six socioeconomic sectors in Doha City, Qatar.

作者信息

Abulibdeh Ammar

机构信息

Department of Humanities, College of Arts and Sciences, Qatar University, P.O. Box: 2713, Doha, Qatar.

出版信息

Appl Energy. 2021 Dec 15;304:117864. doi: 10.1016/j.apenergy.2021.117864. Epub 2021 Sep 17.

DOI:10.1016/j.apenergy.2021.117864
PMID:34580561
原文链接:https://pmc.ncbi.nlm.nih.gov/articles/PMC8457625/
Abstract

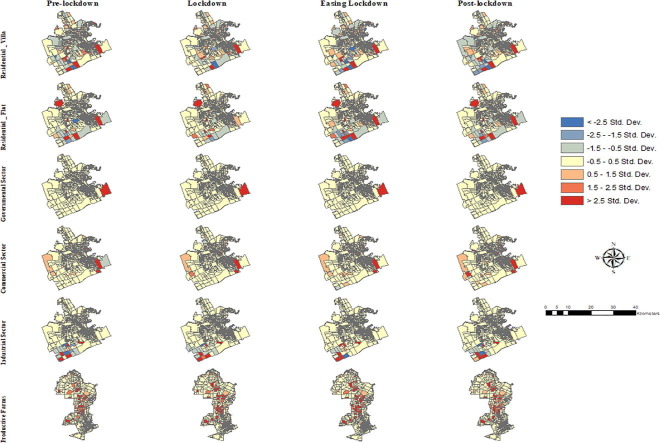
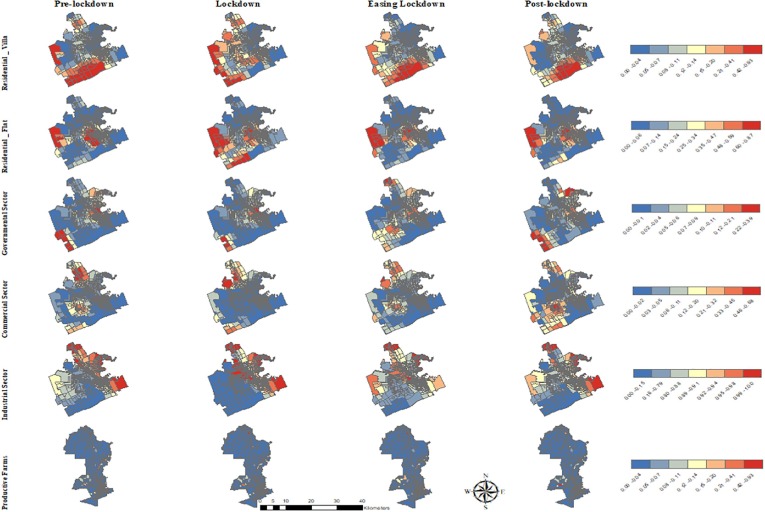
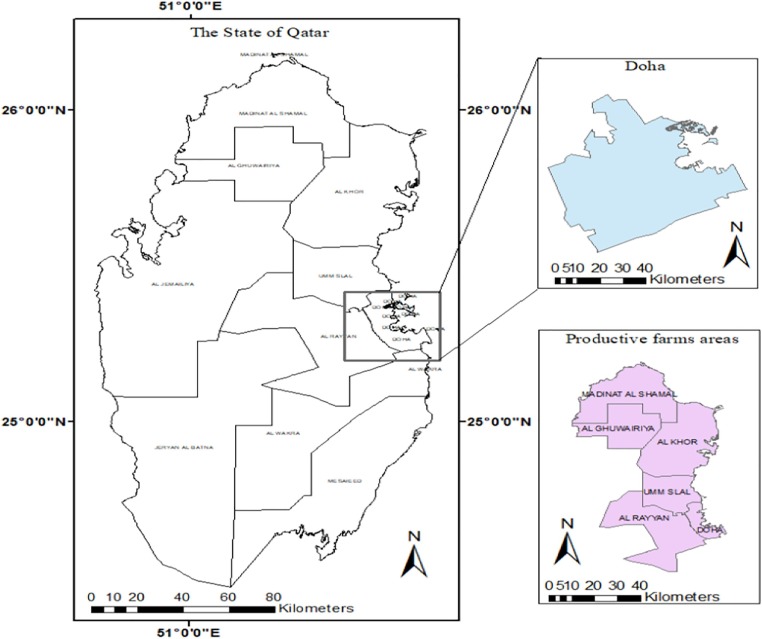
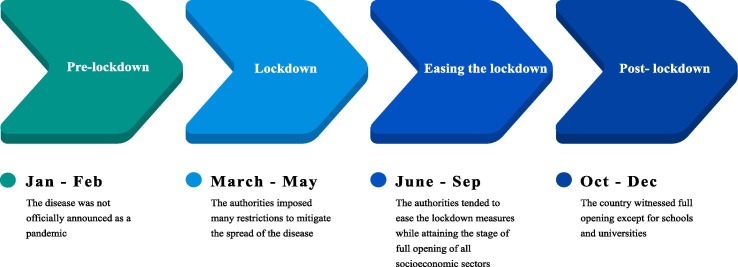
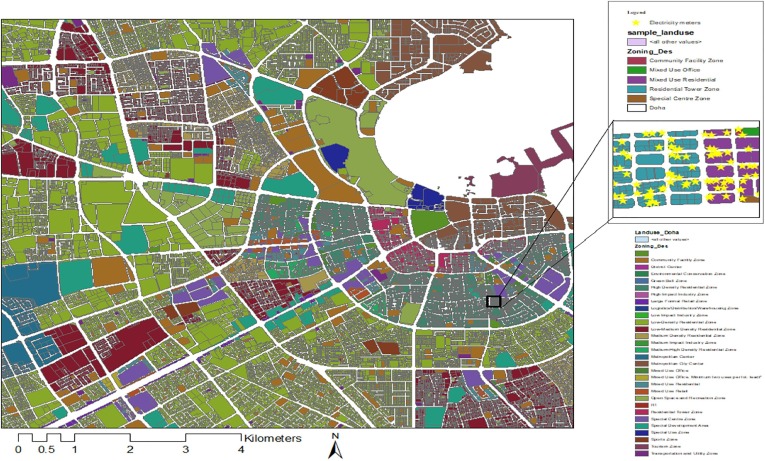
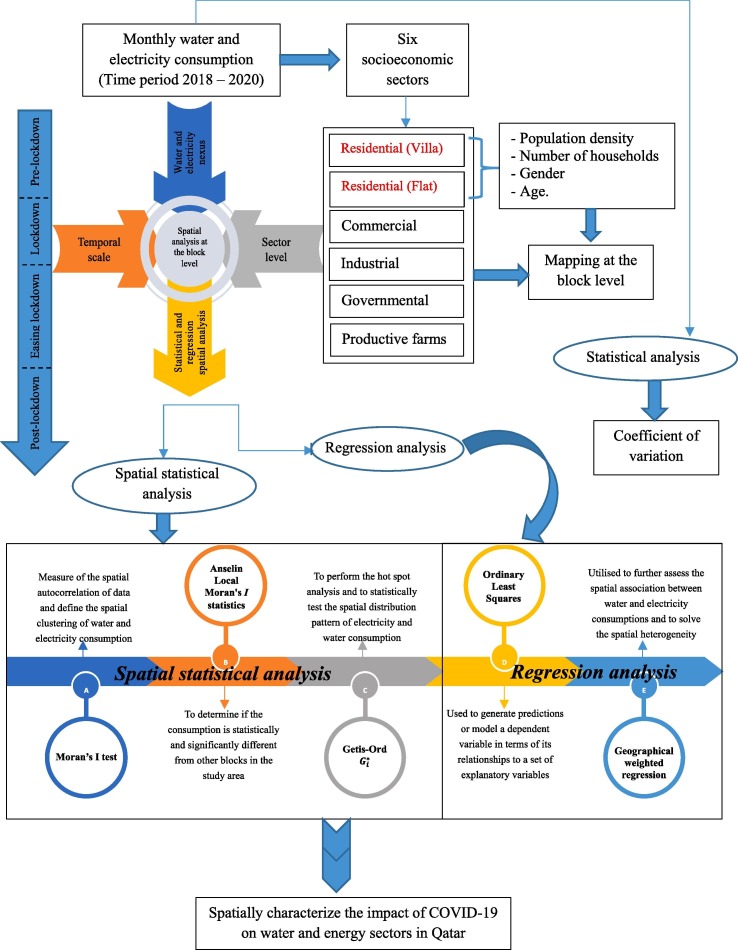
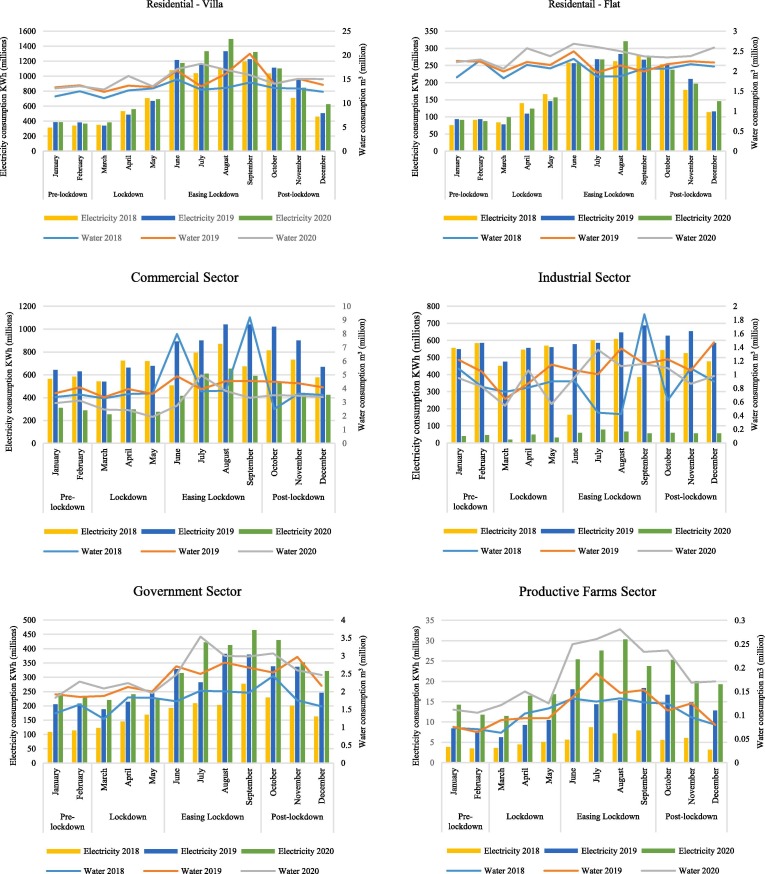
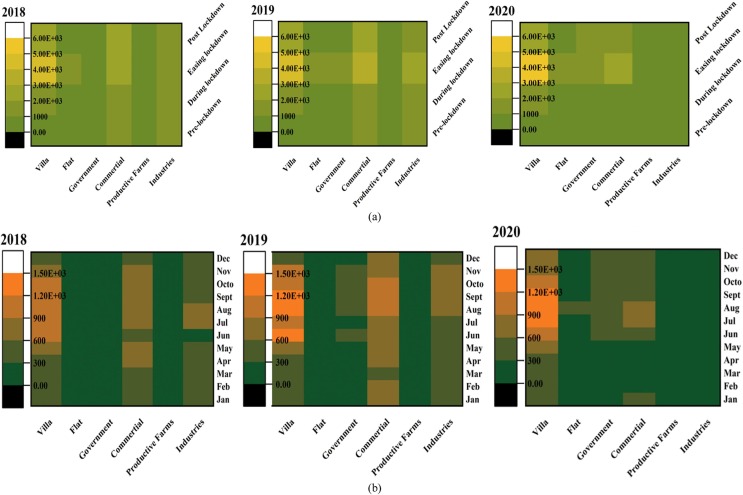
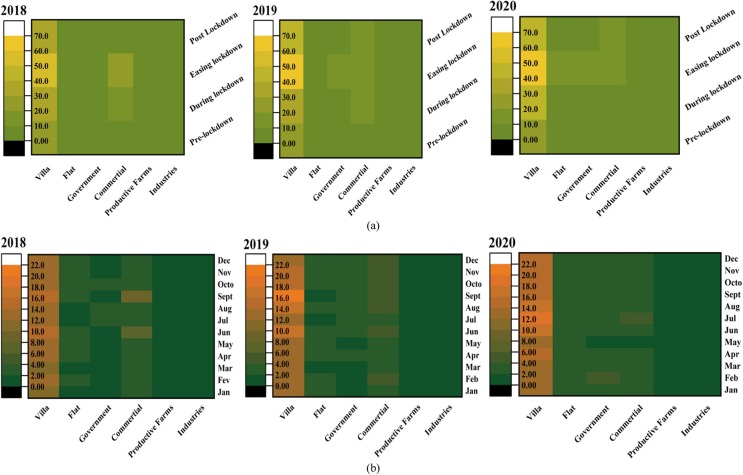
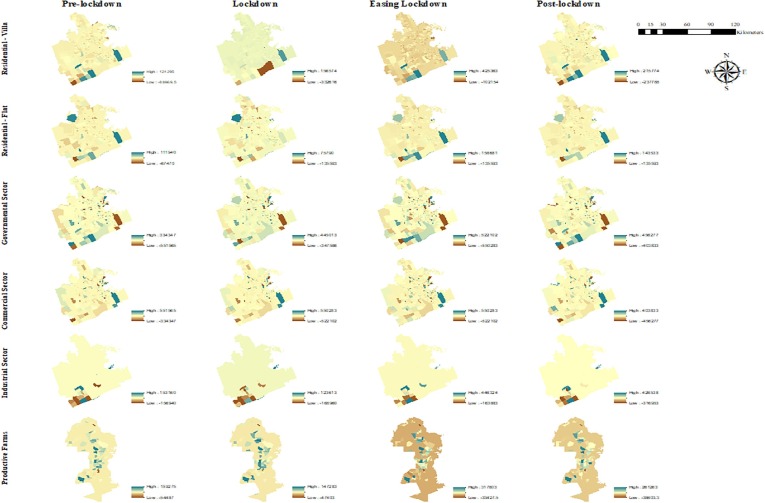
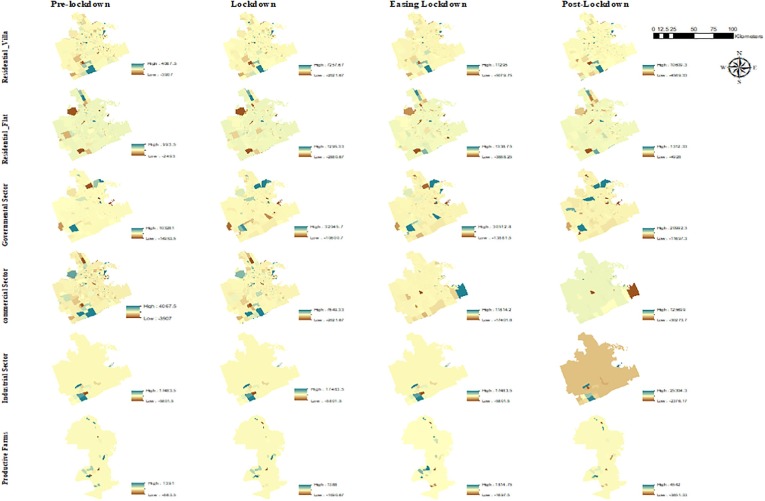
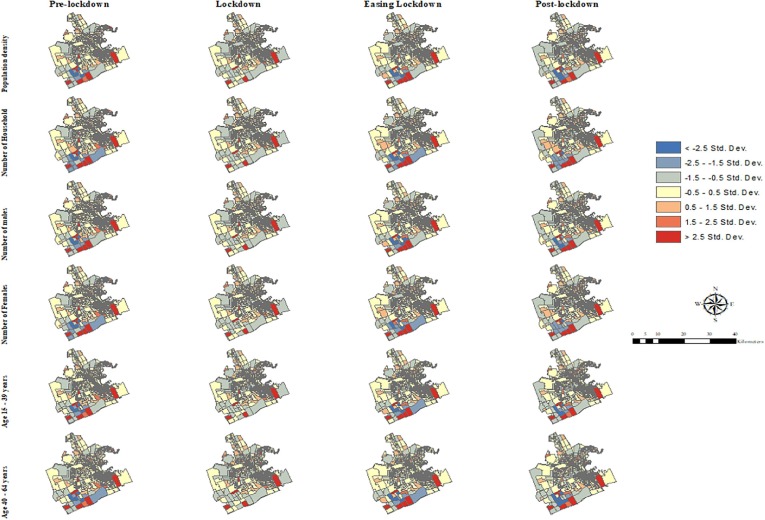
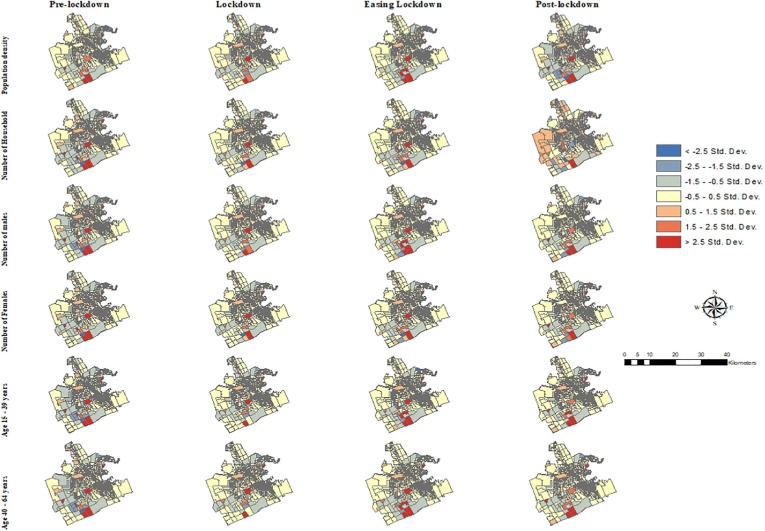
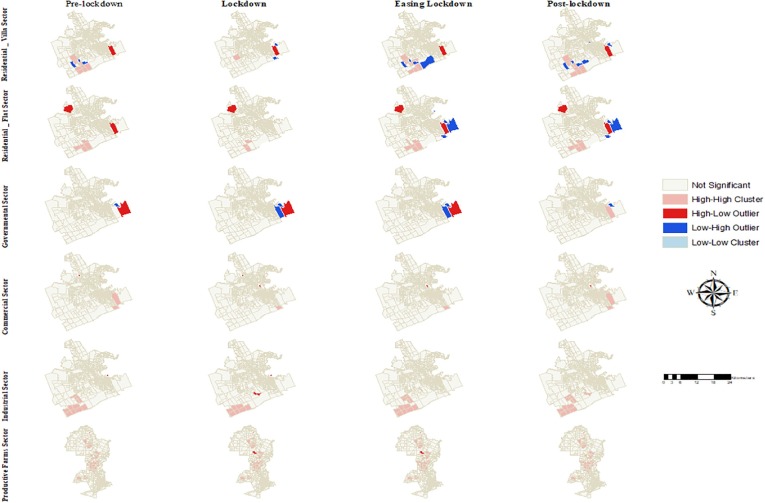
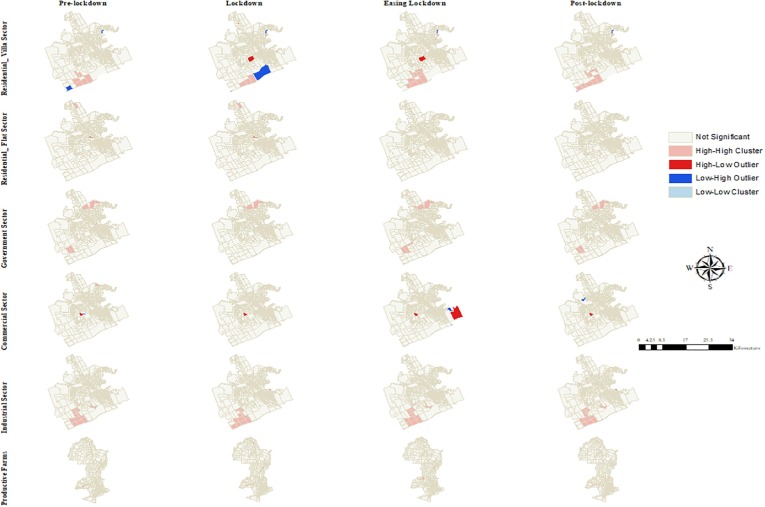
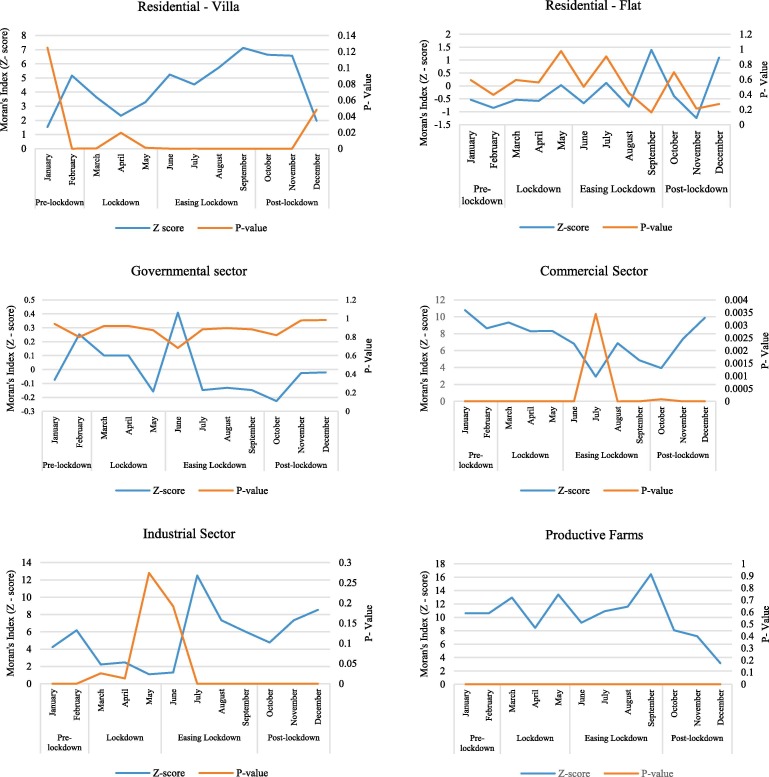
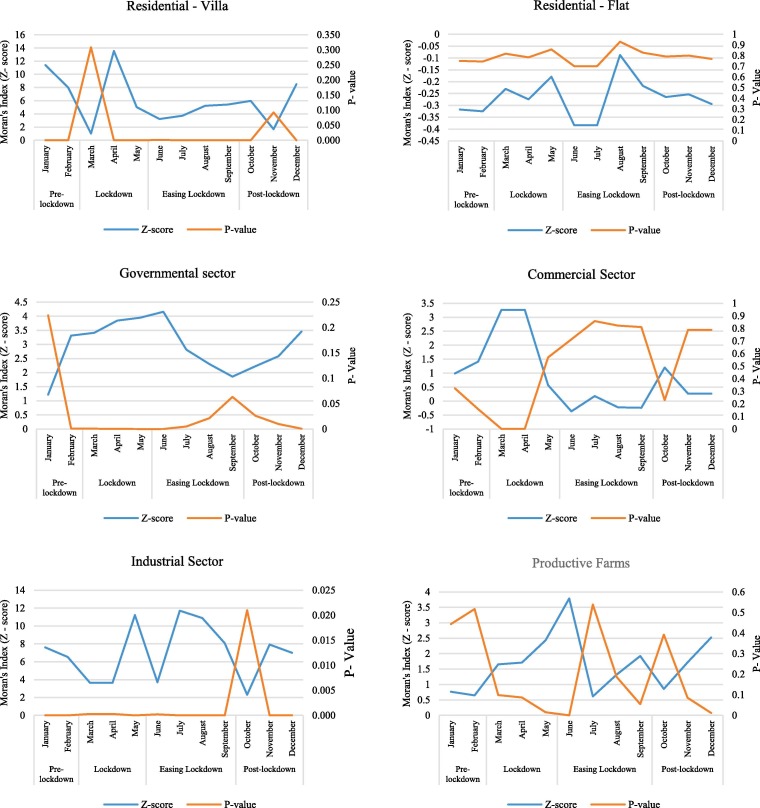
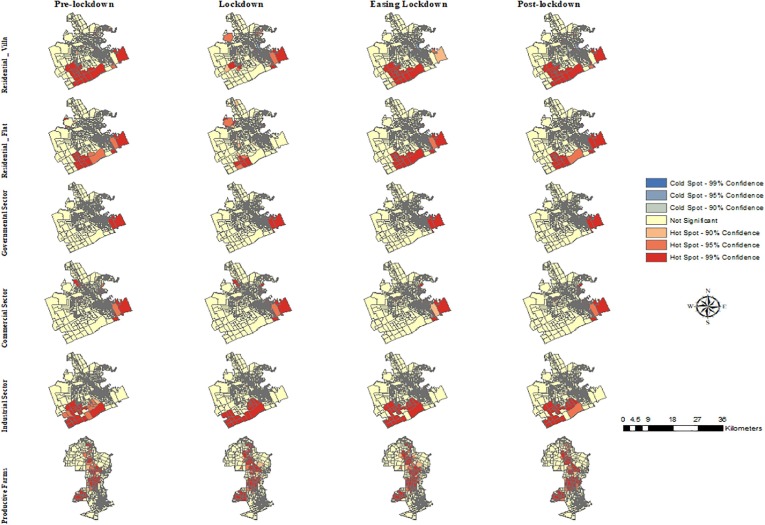
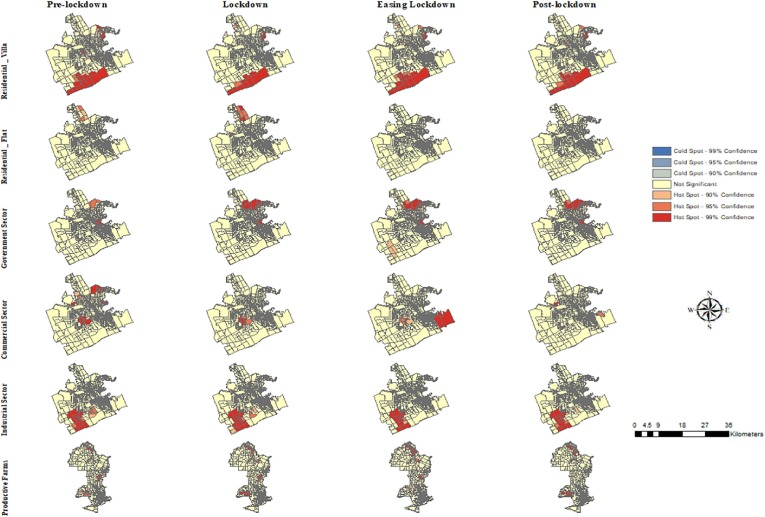
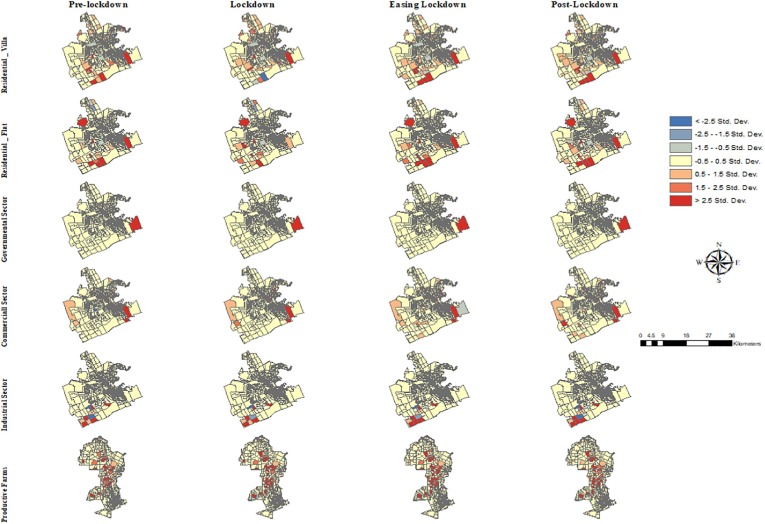
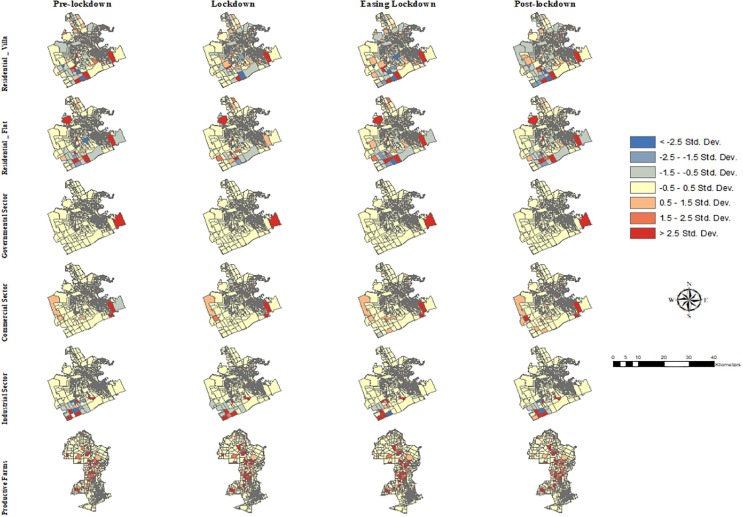
This study investigates the water - electricity consumption in the context of the COVID-19 pandemic across six socioeconomic sectors. Due to inadequate research on spatial modelling of water - electricity consumption in the context of the COVID-19 pandemic, this study investigated geographical block-level variation in water and electricity consumption in Doha city of Qatar. Spatial analyses were performed to investigate the spatial differences in each sector. Five geospatial techniques in a Geographical Information System (GIS) context were used in the study. Moran's , Anselin Local Moran's , and Getis-Ord statistics tools were used to identify the hot spots and cold spots of water and electricity consumption in each sector. Furthermore, Ordinary Least Square (OLS) and Geographically Weighted Regression (GWR) models were employed to investigate the spatial relationship between water and electricity consumption during the pandemic year. The findings show that there is a distinction in water and electricity consumption at the block level across all sectors and over time. Hot spot and spatial regression analysis reveal spatial and temporal heterogeneities in the study area across the six socioeconomic sectors. The intensity of hot spots of water and electricity consumption are found in the southern and western parts of the city due to high population density and the concentration of the commercial and industrial areas. Furthermore, analyzing the spatiotemporal correlation between the water and electricity consumption across the six sectors shows variation within and between these sectors over space and time. The results show a positive relationship between water and electricity consumption in some blocks and over time of each sector. During the lockdown phase, strong positive correlation between water and electricity consumption have exist in the residential sector due to extra water and electricity footprints in this sector. Conversely, the water and electricity consumption were positively correlated but declined in the industrial and commercial sector due to the curtailment in production, economic activities, and reduction in people's mobility. Mapping the hot spot blocks and the blocks with high relationship between water and electricity consumption could provide useful insight to decision-makers for targeted interventions.

摘要

本研究调查了新冠疫情背景下六个社会经济部门的水电消耗情况。由于在新冠疫情背景下对水电消耗的空间建模研究不足,本研究调查了卡塔尔多哈市各街区层面的水电消耗地理差异。进行了空间分析以研究各部门的空间差异。研究中使用了地理信息系统(GIS)环境下的五种地理空间技术。运用莫兰指数、安塞林局部莫兰指数和Getis-Ord统计工具来识别各部门水电消耗的热点和冷点。此外,采用普通最小二乘法(OLS)和地理加权回归(GWR)模型来研究疫情期间水电消耗之间的空间关系。研究结果表明,所有部门在街区层面的水电消耗随时间存在差异。热点和空间回归分析揭示了研究区域内六个社会经济部门在空间和时间上的异质性。由于人口密度高以及商业和工业区集中,水电消耗热点集中在城市的南部和西部。此外,分析六个部门水电消耗之间的时空相关性表明,这些部门在空间和时间上存在内部和相互之间的差异。结果显示,部分街区以及各部门随时间的水电消耗之间存在正相关关系。在封锁阶段,居民部门的水电消耗之间存在强正相关,因为该部门有额外的水电足迹。相反,工业和商业部门的水电消耗呈正相关,但由于生产缩减、经济活动减少和人员流动性降低而下降。绘制热点街区以及水电消耗之间具有高度相关性的街区地图可为决策者提供有针对性干预的有用见解。

https://cdn.ncbi.nlm.nih.gov/pmc/blobs/f3f5/8457625/5ed60f5adddd/gr20_lrg.jpg
https://cdn.ncbi.nlm.nih.gov/pmc/blobs/f3f5/8457625/e2d6db37ff92/ga1_lrg.jpg
https://cdn.ncbi.nlm.nih.gov/pmc/blobs/f3f5/8457625/96cf7b9b0431/gr1_lrg.jpg
https://cdn.ncbi.nlm.nih.gov/pmc/blobs/f3f5/8457625/244299b16bf7/gr2_lrg.jpg
https://cdn.ncbi.nlm.nih.gov/pmc/blobs/f3f5/8457625/7d6e42c11b52/gr3_lrg.jpg
https://cdn.ncbi.nlm.nih.gov/pmc/blobs/f3f5/8457625/059f4ac015ce/gr4_lrg.jpg
https://cdn.ncbi.nlm.nih.gov/pmc/blobs/f3f5/8457625/779d1e2adabc/gr5_lrg.jpg
https://cdn.ncbi.nlm.nih.gov/pmc/blobs/f3f5/8457625/da99bb3b57fc/gr6_lrg.jpg
https://cdn.ncbi.nlm.nih.gov/pmc/blobs/f3f5/8457625/1f6b49f6ad2d/gr7_lrg.jpg
https://cdn.ncbi.nlm.nih.gov/pmc/blobs/f3f5/8457625/d59e59a62c2c/gr8_lrg.jpg
https://cdn.ncbi.nlm.nih.gov/pmc/blobs/f3f5/8457625/571e8028f001/gr9_lrg.jpg
https://cdn.ncbi.nlm.nih.gov/pmc/blobs/f3f5/8457625/29239114c8b7/gr10_lrg.jpg
https://cdn.ncbi.nlm.nih.gov/pmc/blobs/f3f5/8457625/0cafddb30f84/gr11_lrg.jpg
https://cdn.ncbi.nlm.nih.gov/pmc/blobs/f3f5/8457625/b0e98a3c95ed/gr12_lrg.jpg
https://cdn.ncbi.nlm.nih.gov/pmc/blobs/f3f5/8457625/533a6a3fef1d/gr13_lrg.jpg
https://cdn.ncbi.nlm.nih.gov/pmc/blobs/f3f5/8457625/8fa44c79130c/gr14_lrg.jpg
https://cdn.ncbi.nlm.nih.gov/pmc/blobs/f3f5/8457625/71d36ed5053c/gr15_lrg.jpg
https://cdn.ncbi.nlm.nih.gov/pmc/blobs/f3f5/8457625/b7457c89e8bb/gr16_lrg.jpg
https://cdn.ncbi.nlm.nih.gov/pmc/blobs/f3f5/8457625/72e1ae44726e/gr17_lrg.jpg
https://cdn.ncbi.nlm.nih.gov/pmc/blobs/f3f5/8457625/44c479fea140/gr18_lrg.jpg
https://cdn.ncbi.nlm.nih.gov/pmc/blobs/f3f5/8457625/42b10d5d5567/gr19_lrg.jpg
https://cdn.ncbi.nlm.nih.gov/pmc/blobs/f3f5/8457625/5ed60f5adddd/gr20_lrg.jpg

相似文献

1
Spatiotemporal analysis of water-electricity consumption in the context of the COVID-19 pandemic across six socioeconomic sectors in Doha City, Qatar.卡塔尔多哈市六个社会经济部门在新冠疫情背景下水电消耗的时空分析。
Appl Energy. 2021 Dec 15;304:117864. doi: 10.1016/j.apenergy.2021.117864. Epub 2021 Sep 17.
2
Integration of Moran's I, geographically weighted regression (GWR), and ordinary least square (OLS) models in spatiotemporal modeling of COVID-19 outbreak in Qom and Mazandaran Provinces, Iran.莫兰指数(Moran's I)、地理加权回归(GWR)和普通最小二乘法(OLS)模型在伊朗库姆省和马赞德兰省新冠肺炎疫情时空建模中的整合
Model Earth Syst Environ. 2023 Feb 15:1-15. doi: 10.1007/s40808-023-01729-y.
3
Geospatial dynamics of COVID-19 clusters and hotspots in Bangladesh.孟加拉国 COVID-19 集群和热点的地理空间动态。
Transbound Emerg Dis. 2021 Nov;68(6):3643-3657. doi: 10.1111/tbed.13973. Epub 2021 Jan 29.
4
Socio-Demographic Predictors and Distribution of Pulmonary Tuberculosis (TB) in Xinjiang, China: A Spatial Analysis.中国新疆肺结核(TB)的社会人口统计学预测因素及分布:一项空间分析
PLoS One. 2015 Dec 7;10(12):e0144010. doi: 10.1371/journal.pone.0144010. eCollection 2015.
5
Spatiotemporal Assessment of COVID-19 Spread over Oman Using GIS Techniques.利用地理信息系统技术对阿曼境内新冠病毒传播情况的时空评估
Earth Syst Environ. 2020;4(4):797-811. doi: 10.1007/s41748-020-00194-2. Epub 2020 Dec 8.
6
GIS-based spatio-temporal analysis and modeling of COVID-19 incidence rates in Europe.基于 GIS 的欧洲 COVID-19 发病率时空分析与建模。
Spat Spatiotemporal Epidemiol. 2022 Jun;41:100498. doi: 10.1016/j.sste.2022.100498. Epub 2022 Mar 4.
7
Effect analysis of the COVID-19 pandemic on the electricity consumption of Bangladesh.新冠疫情对孟加拉国电力消费的影响分析
Heliyon. 2022 Jan;8(1):e08737. doi: 10.1016/j.heliyon.2022.e08737. Epub 2022 Jan 10.
8
Impact of people's behavior on the energy sustainability of the residential sector in emergency situations caused by COVID-19.新冠疫情引发的紧急情况下人们的行为对住宅部门能源可持续性的影响
Energy Build. 2021 Jan 1;230:110532. doi: 10.1016/j.enbuild.2020.110532. Epub 2020 Oct 9.
9
Determining the effects of socioeconomic and environmental determinants on chronic obstructive pulmonary disease (COPD) mortality using geographically and temporally weighted regression model across Xi'an during 2014-2016.利用地理时空加权回归模型,确定 2014-2016 年期间西安地区社会经济和环境决定因素对慢性阻塞性肺疾病(COPD)死亡率的影响。
Sci Total Environ. 2021 Feb 20;756:143869. doi: 10.1016/j.scitotenv.2020.143869. Epub 2020 Nov 27.
10
Spatiotemporal Analysis for COVID-19 Delta Variant Using GIS-Based Air Parameter and Spatial Modeling.基于 GIS 的空气参数和空间建模的 COVID-19 德尔塔变异的时空分析。
Int J Environ Res Public Health. 2022 Jan 30;19(3):1614. doi: 10.3390/ijerph19031614.

引用本文的文献

1
A new input-output-based framework for measuring the active and passive water use.一种基于投入产出的新型框架,用于测量主动和被动用水情况。
Heliyon. 2024 Sep 16;10(18):e37984. doi: 10.1016/j.heliyon.2024.e37984. eCollection 2024 Sep 30.
2
A Preliminary Assessment of Global CO: Spatial Patterns, Temporal Trends, and Policy Implications.全球一氧化碳的初步评估:空间格局、时间趋势及政策影响
Glob Chall. 2023 Nov 16;7(12):2300184. doi: 10.1002/gch2.202300184. eCollection 2023 Dec.
3
Driving forces and variation in water footprint before and after the COVID-19 lockdown in Fujian Province of China.

本文引用的文献

1
Review analysis of COVID-19 impact on electricity demand for residential buildings.新冠疫情对住宅建筑电力需求影响的综述分析
Renew Sustain Energy Rev. 2021 Jun;143:110888. doi: 10.1016/j.rser.2021.110888. Epub 2021 Mar 2.
2
Impact of the COVID-19 Pandemic on the U.S. Electricity Demand and Supply: An Early View From Data.新冠疫情对美国电力供需的影响:基于数据的早期观察
IEEE Access. 2020 Aug 17;8:151523-151534. doi: 10.1109/ACCESS.2020.3016912. eCollection 2020.
3
Spatiotemporal Assessment of COVID-19 Spread over Oman Using GIS Techniques.
中国福建省新冠疫情封锁前后水足迹的驱动因素及变化
J Clean Prod. 2023 May 20;402:136696. doi: 10.1016/j.jclepro.2023.136696. Epub 2023 Mar 9.
4
Sectoral analysis of electricity consumption during the COVID-19 pandemic: Evidence for unregulated and regulated markets in Colombia.新冠疫情期间电力消费的部门分析:哥伦比亚非管制市场和管制市场的证据
Energy (Oxf). 2023 Apr 1;268:126614. doi: 10.1016/j.energy.2023.126614. Epub 2023 Jan 6.
5
Impact of COVID-19 restrictions on building energy consumption using Phase Change Materials (PCM) and insulation: A case study in six climatic zones of Morocco.新冠疫情限制措施对使用相变材料(PCM)和隔热材料的建筑能耗的影响:以摩洛哥六个气候区为例的研究
J Energy Storage. 2022 Nov 1;55:105374. doi: 10.1016/j.est.2022.105374. Epub 2022 Aug 1.
6
How residential energy consumption has changed due to COVID-19 pandemic? An agent-based model.新冠疫情如何改变了居民能源消耗?基于主体的模型。
Sustain Cities Soc. 2022 Jun;81:103832. doi: 10.1016/j.scs.2022.103832. Epub 2022 Mar 10.
7
Future assessment of the impact of the COVID-19 pandemic on the electricity market based on a stochastic socioeconomic model.基于随机社会经济模型对新冠疫情对电力市场影响的未来评估。
Appl Energy. 2022 May 1;313:118848. doi: 10.1016/j.apenergy.2022.118848. Epub 2022 Mar 2.
8
COVID-19 and Sustainable Development Goals (SDGs): Scenario analysis through fuzzy cognitive map modeling.2019冠状病毒病与可持续发展目标:通过模糊认知图建模进行情景分析
Gondwana Res. 2023 Feb;114:138-155. doi: 10.1016/j.gr.2021.12.014. Epub 2022 Jan 29.
9
Assessing the impact of the COVID-19 lockdown on the energy consumption of university buildings.评估新冠疫情封锁对大学建筑能源消耗的影响。
Energy Build. 2022 Feb 15;257:111783. doi: 10.1016/j.enbuild.2021.111783. Epub 2021 Dec 16.
利用地理信息系统技术对阿曼境内新冠病毒传播情况的时空评估
Earth Syst Environ. 2020;4(4):797-811. doi: 10.1007/s41748-020-00194-2. Epub 2020 Dec 8.
4
Analysis of urban heat island characteristics and mitigation strategies for eight arid and semi-arid gulf region cities.八个干旱和半干旱海湾地区城市的城市热岛特征分析及缓解策略
Environ Earth Sci. 2021;80(7):259. doi: 10.1007/s12665-021-09540-7. Epub 2021 Mar 22.
5
Change in outbreak epicentre and its impact on the importation risks of COVID-19 progression: A modelling study.疫情中心的变化及其对 COVID-19 进展输入风险的影响:一项建模研究。
Travel Med Infect Dis. 2021 Mar-Apr;40:101988. doi: 10.1016/j.tmaid.2021.101988. Epub 2021 Feb 9.
6
Variation in the "coefficient of variation": Rethinking the violation of the scalar property in time-duration judgments.“变异系数”的变化:重新思考时间判断中标量性质的违反。
Acta Psychol (Amst). 2021 Mar;214:103263. doi: 10.1016/j.actpsy.2021.103263. Epub 2021 Jan 30.
7
Impacts of COVID-19 on energy demand and consumption: Challenges, lessons and emerging opportunities.新冠疫情对能源需求和消费的影响:挑战、教训与新机遇
Appl Energy. 2021 Mar 1;285:116441. doi: 10.1016/j.apenergy.2021.116441. Epub 2021 Jan 9.
8
Electricity demand during pandemic times: The case of the COVID-19 in Spain.疫情期间的电力需求:以西班牙的新冠疫情为例。
Energy Policy. 2021 Jan;148:111964. doi: 10.1016/j.enpol.2020.111964. Epub 2020 Oct 13.
9
COVID-19: Impact analysis and recommendations for power sector operation.新型冠状病毒肺炎:电力行业运营的影响分析与建议
Appl Energy. 2020 Dec 1;279:115739. doi: 10.1016/j.apenergy.2020.115739. Epub 2020 Aug 31.
10
The impact of different COVID-19 containment measures on electricity consumption in Europe.不同新冠疫情防控措施对欧洲电力消耗的影响。
Energy Res Soc Sci. 2020 Oct;68:101683. doi: 10.1016/j.erss.2020.101683. Epub 2020 Jul 3.