• 文献检索
  • 文档翻译
  • 深度研究
  • 学术资讯
  • Suppr Zotero 插件Zotero 插件
  • 邀请有礼
  • 套餐&价格
  • 历史记录
应用&插件
Suppr Zotero 插件Zotero 插件浏览器插件Mac 客户端Windows 客户端微信小程序
定价
高级版会员购买积分包购买API积分包
服务
文献检索文档翻译深度研究API 文档MCP 服务
关于我们
关于 Suppr公司介绍联系我们用户协议隐私条款
关注我们

Suppr 超能文献

核心技术专利:CN118964589B侵权必究
粤ICP备2023148730 号-1Suppr @ 2026

文献检索

告别复杂PubMed语法,用中文像聊天一样搜索,搜遍4000万医学文献。AI智能推荐,让科研检索更轻松。

立即免费搜索

文件翻译

保留排版,准确专业,支持PDF/Word/PPT等文件格式,支持 12+语言互译。

免费翻译文档

深度研究

AI帮你快速写综述,25分钟生成高质量综述,智能提取关键信息,辅助科研写作。

立即免费体验

探究微生物组数据中的差异丰度方法:基准研究。

Investigating differential abundance methods in microbiome data: A benchmark study.

机构信息

Department of Information Engineering, University of Padova, Padova, Italy.

Department of Comparative Biomedicine and Food Science, University of Padova, Padova, Italy.

出版信息

PLoS Comput Biol. 2022 Sep 8;18(9):e1010467. doi: 10.1371/journal.pcbi.1010467. eCollection 2022 Sep.

DOI:10.1371/journal.pcbi.1010467
PMID:36074761
原文链接:https://pmc.ncbi.nlm.nih.gov/articles/PMC9488820/
Abstract

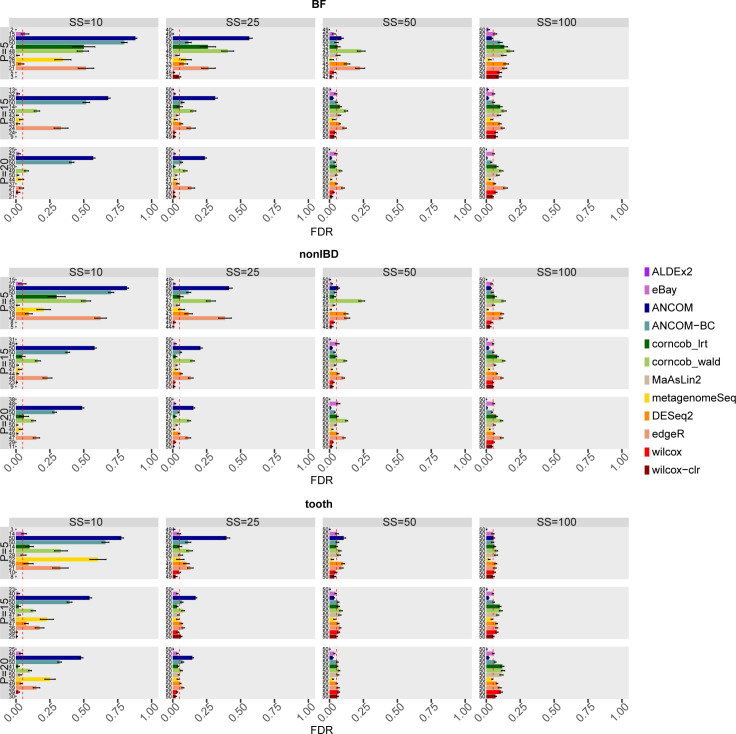
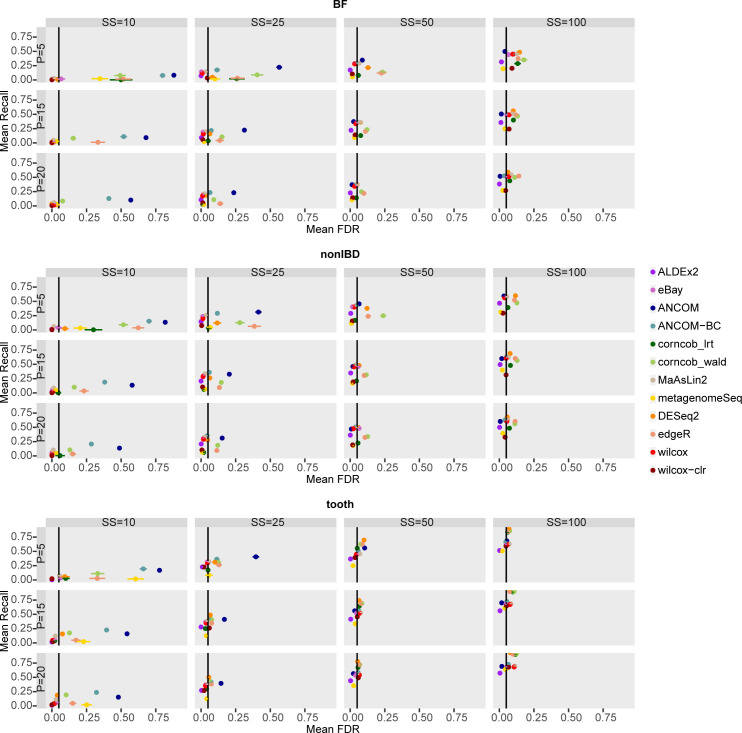
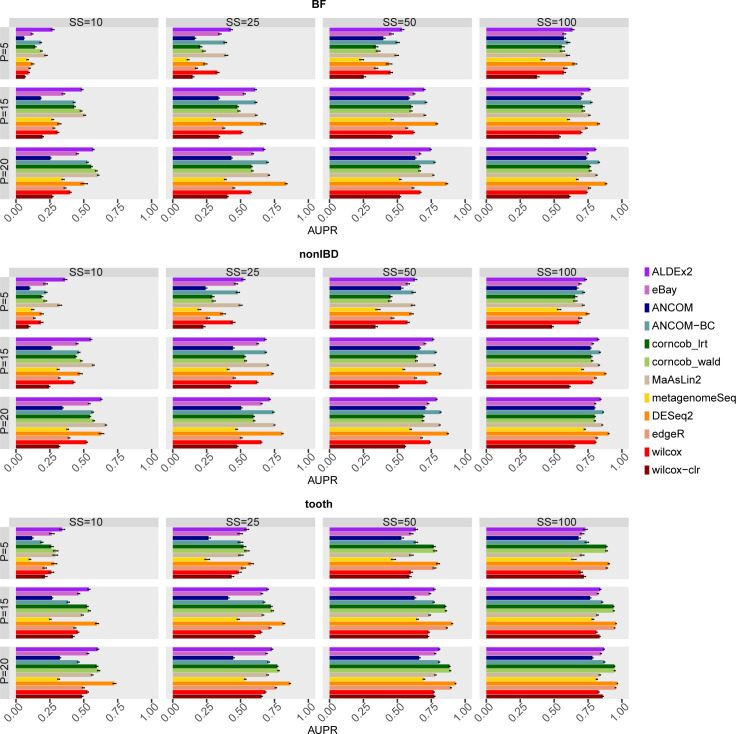
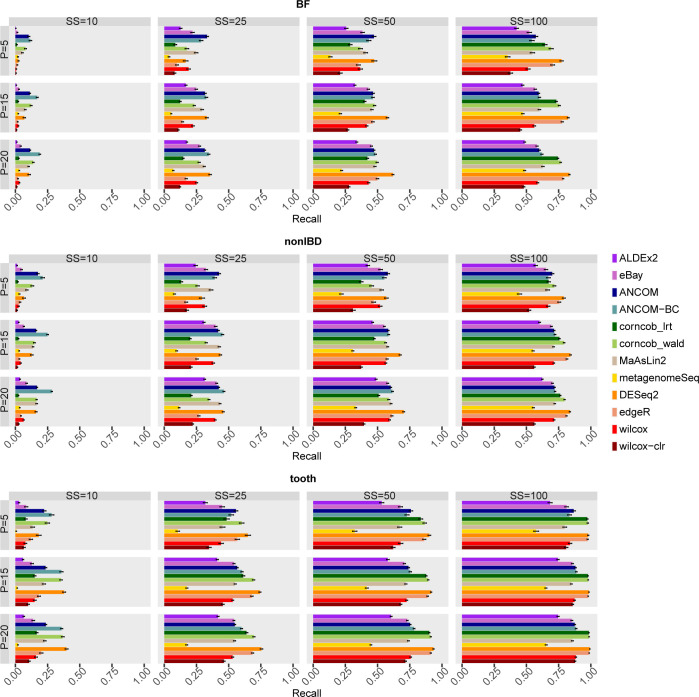
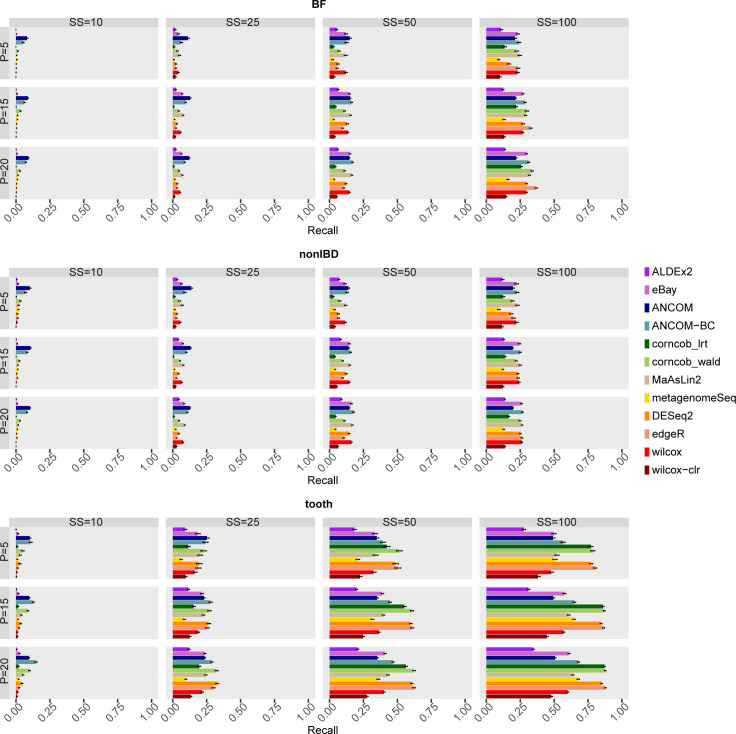
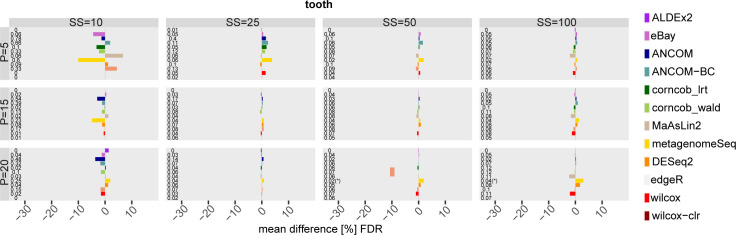
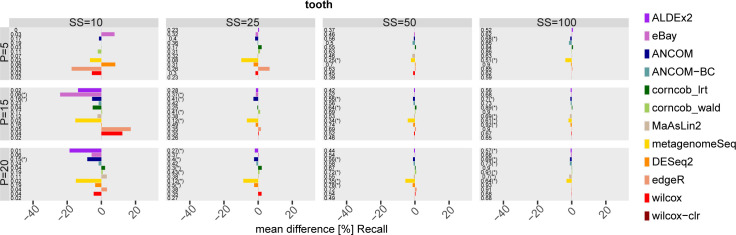
The development of increasingly efficient and cost-effective high throughput DNA sequencing techniques has enhanced the possibility of studying complex microbial systems. Recently, researchers have shown great interest in studying the microorganisms that characterise different ecological niches. Differential abundance analysis aims to find the differences in the abundance of each taxa between two classes of subjects or samples, assigning a significance value to each comparison. Several bioinformatic methods have been specifically developed, taking into account the challenges of microbiome data, such as sparsity, the different sequencing depth constraint between samples and compositionality. Differential abundance analysis has led to important conclusions in different fields, from health to the environment. However, the lack of a known biological truth makes it difficult to validate the results obtained. In this work we exploit metaSPARSim, a microbial sequencing count data simulator, to simulate data with differential abundance features between experimental groups. We perform a complete comparison of recently developed and established methods on a common benchmark with great effort to the reliability of both the simulated scenarios and the evaluation metrics. The performance overview includes the investigation of numerous scenarios, studying the effect on methods' results on the main covariates such as sample size, percentage of differentially abundant features, sequencing depth, feature variability, normalisation approach and ecological niches. Mainly, we find that methods show a good control of the type I error and, generally, also of the false discovery rate at high sample size, while recall seem to depend on the dataset and sample size.

摘要

高通量 DNA 测序技术的不断发展和成本效益的提高,增加了研究复杂微生物系统的可能性。最近,研究人员对研究不同生态位特征的微生物表现出了极大的兴趣。差异丰度分析旨在发现两组受试者或样本之间每个分类群丰度的差异,并为每个比较分配一个显著值。已经专门开发了几种生物信息学方法,考虑到微生物组数据的挑战,例如稀疏性、样本之间不同测序深度的约束和组成性。差异丰度分析在从健康到环境的不同领域得出了重要结论。然而,缺乏已知的生物学事实使得难以验证所获得的结果。在这项工作中,我们利用 metaSPARSim,一种微生物测序计数数据模拟器,在实验分组之间具有差异丰度特征的模拟数据。我们在一个共同的基准上对最近开发和建立的方法进行了全面的比较,非常注重模拟场景和评估指标的可靠性。性能概述包括对许多场景的研究,研究主要协变量(例如样本量、差异丰度特征的百分比、测序深度、特征可变性、归一化方法和生态位)对方法结果的影响。主要发现是,方法在高样本量时,对第一类错误和假发现率的控制较好,而召回率似乎取决于数据集和样本量。

https://cdn.ncbi.nlm.nih.gov/pmc/blobs/d8c9/9488820/c9cca44f9fa5/pcbi.1010467.g012.jpg
https://cdn.ncbi.nlm.nih.gov/pmc/blobs/d8c9/9488820/b4dd629eeeae/pcbi.1010467.g001.jpg
https://cdn.ncbi.nlm.nih.gov/pmc/blobs/d8c9/9488820/9ec2151e4242/pcbi.1010467.g002.jpg
https://cdn.ncbi.nlm.nih.gov/pmc/blobs/d8c9/9488820/04fb13cd212f/pcbi.1010467.g003.jpg
https://cdn.ncbi.nlm.nih.gov/pmc/blobs/d8c9/9488820/d654a6028058/pcbi.1010467.g004.jpg
https://cdn.ncbi.nlm.nih.gov/pmc/blobs/d8c9/9488820/dc37a8400622/pcbi.1010467.g005.jpg
https://cdn.ncbi.nlm.nih.gov/pmc/blobs/d8c9/9488820/e2db17a81e7f/pcbi.1010467.g006.jpg
https://cdn.ncbi.nlm.nih.gov/pmc/blobs/d8c9/9488820/67e02680e650/pcbi.1010467.g007.jpg
https://cdn.ncbi.nlm.nih.gov/pmc/blobs/d8c9/9488820/d3f237d235f7/pcbi.1010467.g008.jpg
https://cdn.ncbi.nlm.nih.gov/pmc/blobs/d8c9/9488820/8696a40c3aed/pcbi.1010467.g009.jpg
https://cdn.ncbi.nlm.nih.gov/pmc/blobs/d8c9/9488820/075a27f3b9cb/pcbi.1010467.g010.jpg
https://cdn.ncbi.nlm.nih.gov/pmc/blobs/d8c9/9488820/f7a898b891fe/pcbi.1010467.g011.jpg
https://cdn.ncbi.nlm.nih.gov/pmc/blobs/d8c9/9488820/c9cca44f9fa5/pcbi.1010467.g012.jpg

相似文献

1
Investigating differential abundance methods in microbiome data: A benchmark study.探究微生物组数据中的差异丰度方法:基准研究。
PLoS Comput Biol. 2022 Sep 8;18(9):e1010467. doi: 10.1371/journal.pcbi.1010467. eCollection 2022 Sep.
2
metaSPARSim: a 16S rRNA gene sequencing count data simulator.metaSPARSim:一种 16S rRNA 基因测序计数数据模拟器。
BMC Bioinformatics. 2019 Nov 22;20(Suppl 9):416. doi: 10.1186/s12859-019-2882-6.
3
Large-scale benchmarking reveals false discoveries and count transformation sensitivity in 16S rRNA gene amplicon data analysis methods used in microbiome studies.大规模基准测试揭示了微生物组研究中使用的 16S rRNA 基因扩增子数据分析方法中的假发现和计数转换敏感性。
Microbiome. 2016 Nov 25;4(1):62. doi: 10.1186/s40168-016-0208-8.
4
MIDASim: a fast and simple simulator for realistic microbiome data.MIDASim:一个快速而简单的用于真实微生物组数据模拟的工具。
Microbiome. 2024 Jul 22;12(1):135. doi: 10.1186/s40168-024-01822-z.
5
Rarefaction is currently the best approach to control for uneven sequencing effort in amplicon sequence analyses.稀疏化是目前控制扩增子序列分析中测序努力不均匀的最佳方法。
mSphere. 2024 Feb 28;9(2):e0035423. doi: 10.1128/msphere.00354-23. Epub 2024 Jan 22.
6
A comparative study of k-spectrum-based error correction methods for next-generation sequencing data analysis.基于k谱的下一代测序数据分析纠错方法的比较研究。
Hum Genomics. 2016 Jul 25;10 Suppl 2(Suppl 2):20. doi: 10.1186/s40246-016-0068-0.
7
Processing a 16S rRNA Sequencing Dataset with the Microbiome Helper Workflow.使用微生物组助手工作流程处理16S rRNA测序数据集。
Methods Mol Biol. 2018;1849:131-141. doi: 10.1007/978-1-4939-8728-3_9.
8
MIDASim: a fast and simple simulator for realistic microbiome data.MIDASim:一款用于逼真微生物组数据的快速简易模拟器。
bioRxiv. 2024 Mar 27:2023.03.23.533996. doi: 10.1101/2023.03.23.533996.
9
High throughput sequencing methods and analysis for microbiome research.高通量测序方法及其在微生物组研究中的分析。
J Microbiol Methods. 2013 Dec;95(3):401-14. doi: 10.1016/j.mimet.2013.08.011. Epub 2013 Sep 9.
10
A comparison of sequencing platforms and bioinformatics pipelines for compositional analysis of the gut microbiome.用于肠道微生物组组成分析的测序平台和生物信息学管道的比较。
BMC Microbiol. 2017 Sep 13;17(1):194. doi: 10.1186/s12866-017-1101-8.

引用本文的文献

1
The ocular surface microbiome of rhesus macaques.恒河猴的眼表微生物群
Anim Microbiome. 2025 Aug 20;7(1):88. doi: 10.1186/s42523-025-00454-4.
2
gLinDA: A privacy-preserving, swarm learning toolbox for differential abundance analysis of microbiomes.gLinDA:一种用于微生物群落差异丰度分析的隐私保护群体学习工具箱。
Comput Struct Biotechnol J. 2025 Jul 31;27:3456-3463. doi: 10.1016/j.csbj.2025.07.031. eCollection 2025.
3
A workflow for statistical analysis and visualization of microbiome omics data using the R microeco package.

本文引用的文献

1
Beware to ignore the rare: how imputing zero-values can improve the quality of 16S rRNA gene studies results.警惕忽视罕见情况:如何通过赋零值来提高 16S rRNA 基因研究结果的质量。
BMC Bioinformatics. 2022 Feb 7;22(Suppl 15):618. doi: 10.1186/s12859-022-04587-0.
2
Microbiome differential abundance methods produce different results across 38 datasets.微生物组差异丰度方法在 38 个数据集上产生了不同的结果。
Nat Commun. 2022 Jan 17;13(1):342. doi: 10.1038/s41467-022-28034-z.
3
Analysing microbiome intervention design studies: Comparison of alternative multivariate statistical methods.
一种使用R语言的microeco软件包对微生物组组学数据进行统计分析和可视化的工作流程。
Nat Protoc. 2025 Aug 6. doi: 10.1038/s41596-025-01239-4.
4
metaGEENOME: an integrated framework for differential abundance analysis of microbiome data in cross-sectional and longitudinal studies.metaGEENOME:一个用于横断面和纵向研究中微生物组数据差异丰度分析的综合框架。
BMC Bioinformatics. 2025 Jul 21;26(1):189. doi: 10.1186/s12859-025-06217-x.
5
The ocular surface microbiome of rhesus macaques.恒河猴的眼表微生物群
Res Sq. 2025 Mar 14:rs.3.rs-6205866. doi: 10.21203/rs.3.rs-6205866/v1.
6
Elementary methods provide more replicable results in microbial differential abundance analysis.在微生物差异丰度分析中,基本方法能提供更具可重复性的结果。
Brief Bioinform. 2025 Mar 4;26(2). doi: 10.1093/bib/bbaf130.
7
Metagenomic analyses of gut microbiome composition and function with age in a wild bird; little change, except increased transposase gene abundance.野生鸟类肠道微生物群落组成和功能随年龄变化的宏基因组分析;除转座酶基因丰度增加外,变化不大。
ISME Commun. 2025 Jan 23;5(1):ycaf008. doi: 10.1093/ismeco/ycaf008. eCollection 2025 Jan.
8
Computational Study Protocol: Leveraging Synthetic Data to Validate a Benchmark Study for Differential Abundance Tests for 16S Microbiome Sequencing Data.计算研究方案:利用合成数据验证16S微生物组测序数据差异丰度测试的基准研究
F1000Res. 2025 Jan 2;13:1180. doi: 10.12688/f1000research.155230.2. eCollection 2024.
9
Microbial fuel cells to monitor natural attenuation around groundwater plumes.微生物燃料电池用于监测地下水羽流周围的自然衰减。
Environ Sci Pollut Res Int. 2025 Jan;32(4):2069-2084. doi: 10.1007/s11356-024-35848-5. Epub 2025 Jan 4.
10
Statistical methods for comparing two independent exponential-gamma means with application to single cell protein data.用于比较两个独立指数-伽马均值的统计方法及其在单细胞蛋白质数据中的应用。
PLoS One. 2024 Dec 13;19(12):e0314705. doi: 10.1371/journal.pone.0314705. eCollection 2024.
分析微生物组干预设计研究:替代多元统计方法的比较。
PLoS One. 2021 Nov 18;16(11):e0259973. doi: 10.1371/journal.pone.0259973. eCollection 2021.
4
Multivariable association discovery in population-scale meta-omics studies.基于人群的宏基因组学研究中的多变量关联发现。
PLoS Comput Biol. 2021 Nov 16;17(11):e1009442. doi: 10.1371/journal.pcbi.1009442. eCollection 2021 Nov.
5
A statistical model for describing and simulating microbial community profiles.用于描述和模拟微生物群落分布的统计模型。
PLoS Comput Biol. 2021 Sep 13;17(9):e1008913. doi: 10.1371/journal.pcbi.1008913. eCollection 2021 Sep.
6
Comparison of 16S and whole genome dog microbiomes using machine learning.使用机器学习对16S和全基因组犬微生物群进行比较。
BioData Min. 2021 Aug 21;14(1):41. doi: 10.1186/s13040-021-00270-x.
7
A zero inflated log-normal model for inference of sparse microbial association networks.零膨胀对数正态模型用于推断稀疏微生物关联网络。
PLoS Comput Biol. 2021 Jun 18;17(6):e1009089. doi: 10.1371/journal.pcbi.1009089. eCollection 2021 Jun.
8
Comparison study of differential abundance testing methods using two large Parkinson disease gut microbiome datasets derived from 16S amplicon sequencing.使用源自 16S 扩增子测序的两个大型帕金森病肠道微生物组数据集进行差异丰度检测方法的比较研究。
BMC Bioinformatics. 2021 May 25;22(1):265. doi: 10.1186/s12859-021-04193-6.
9
Staphylococcal Communities on Skin Are Associated with Atopic Dermatitis and Disease Severity.皮肤上的葡萄球菌群落与特应性皮炎及疾病严重程度相关。
Microorganisms. 2021 Feb 19;9(2):432. doi: 10.3390/microorganisms9020432.
10
A Zero-Inflated Latent Dirichlet Allocation Model for Microbiome Studies.用于微生物组研究的零膨胀潜在狄利克雷分配模型。
Front Genet. 2021 Jan 22;11:602594. doi: 10.3389/fgene.2020.602594. eCollection 2020.