• 文献检索
  • 文档翻译
  • 深度研究
  • 学术资讯
  • Suppr Zotero 插件Zotero 插件
  • 邀请有礼
  • 套餐&价格
  • 历史记录
应用&插件
Suppr Zotero 插件Zotero 插件浏览器插件Mac 客户端Windows 客户端微信小程序
定价
高级版会员购买积分包购买API积分包
服务
文献检索文档翻译深度研究API 文档MCP 服务
关于我们
关于 Suppr公司介绍联系我们用户协议隐私条款
关注我们

Suppr 超能文献

核心技术专利:CN118964589B侵权必究
粤ICP备2023148730 号-1Suppr @ 2026

文献检索

告别复杂PubMed语法,用中文像聊天一样搜索,搜遍4000万医学文献。AI智能推荐,让科研检索更轻松。

立即免费搜索

文件翻译

保留排版,准确专业,支持PDF/Word/PPT等文件格式,支持 12+语言互译。

免费翻译文档

深度研究

AI帮你快速写综述,25分钟生成高质量综述,智能提取关键信息,辅助科研写作。

立即免费体验

日本北海道中央地区 CMIP6 情景下的气候变化多模式预估。

Climate change multi-model projections in CMIP6 scenarios in Central Hokkaido, Japan.

机构信息

Institute of Subtropical Agriculture, Chinese Academy of Sciences, Changsha, 410125, China.

Research Faculty of Agriculture, Hokkaido University, Sapporo, 0608589, Japan.

出版信息

Sci Rep. 2023 Jan 5;13(1):230. doi: 10.1038/s41598-022-27357-7.

DOI:10.1038/s41598-022-27357-7
PMID:36604582
原文链接:https://pmc.ncbi.nlm.nih.gov/articles/PMC9816114/
Abstract

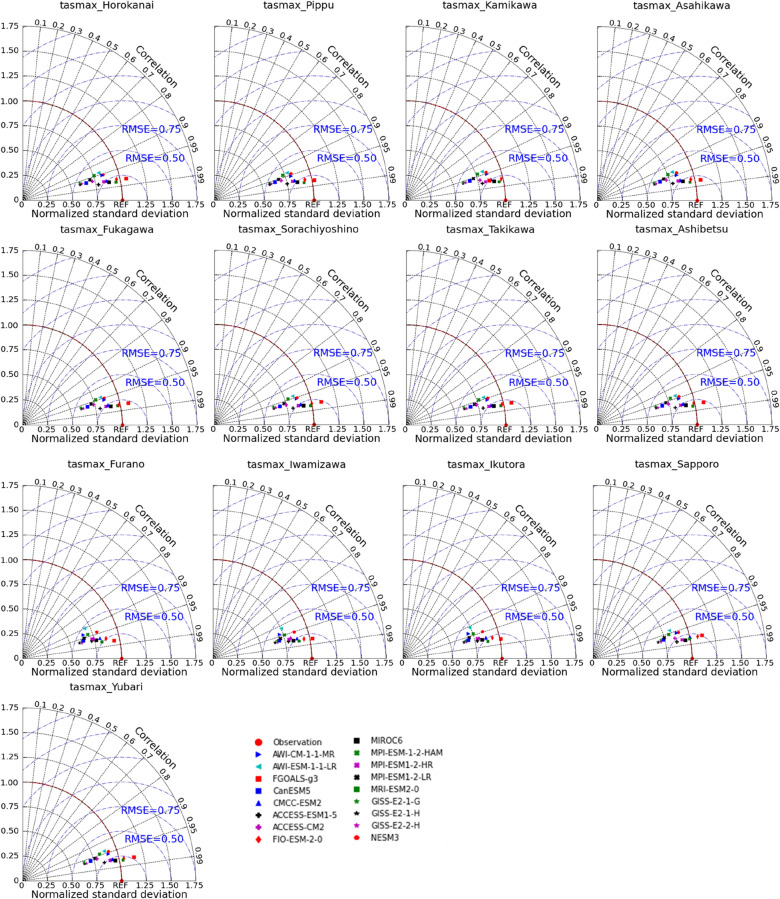
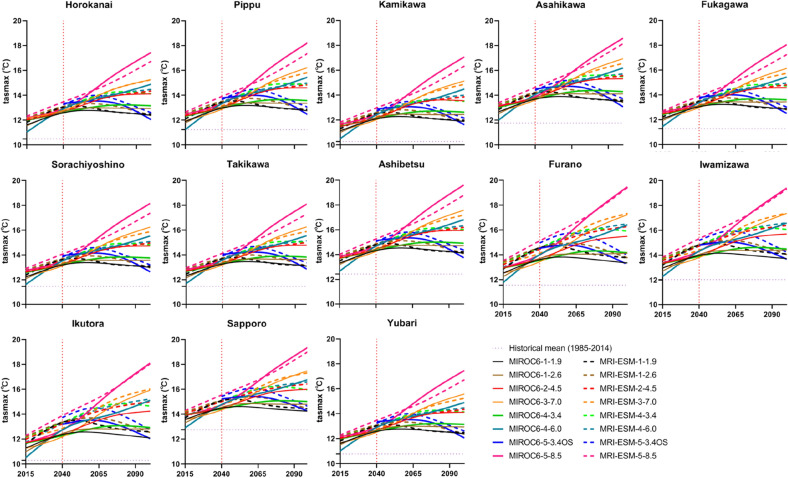
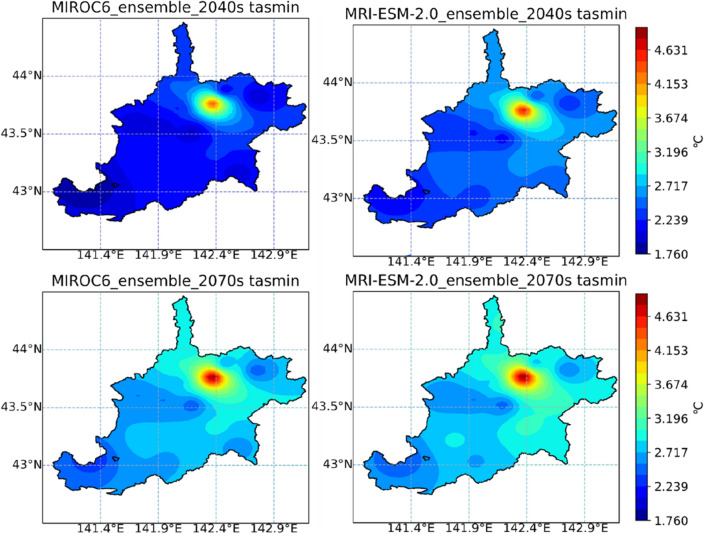
Simulation of future climate changes, especially temperature and rainfall, is critical for water resource management, disaster mitigation, and agricultural development. Based on the category-wise indicator method, two preferred Global Climate Models (GCMs) for the Ishikari River basin (IRB), the socio-economic center of Hokkaido, Japan, were examined from the newly released Coupled Model Intercomparison Project Phase 6 (CMIP6). Climatic variables (maximum/minimum temperature and precipitation) were projected by the Statistical DownScaling Model (SDSM) under all shared socioeconomic pathway-representative concentration pathway (SSP-RCP) scenarios (SSP1-1.9, SSP1-2.6, SSP2-4.5, SSP3-7.0, SSP4-3.4, SSP4-6.0, SSP5-3.4OS, and SSP5-8.5) in two phases: 2040-2069 (2040s) and 2070-2099 (2070s), with the period of 1985-2014 as the baseline. Predictors of SDSM were derived from CMIP6 GCMs and the reanalysis dataset NOAA-CIRES-DOE 20th Century Reanalysis V3 (20CRv3). Results showed that CMIP6 GCMs had a significant correlation with temperature measurements, but could not represent precipitation features in the IRB. The constructed SDSM could capture the characteristics of temperature and precipitation during the calibration (1985-1999) and validation (2000-2014) phases, respectively. The selected GCMs (MIROC6 and MRI-ESM-2.0) generated higher temperature and less rainfall in the forthcoming phases. The SSP-RCP scenarios had an apparent influence on temperature and precipitation. High-emission scenarios (i.e., SSP5-8.5) would project a higher temperature and lower rainfall than the low-emission scenarios (e.g., SSP1-1.9). Spatial-temporal analysis indicated that the northern part of the IRB is more likely to become warmer with heavier precipitation than the southern part in the future. Higher temperature and lower rainfall were projected throughout the late twenty-first century (2070s) than the mid-century (2040s) in the IRB. The findings of this study could be further used to predict the hydrological cycle and assess the ecosystem's sustainability.

摘要

未来气候变化,特别是温度和降雨量的模拟,对水资源管理、灾害缓解和农业发展至关重要。本研究基于类别指标方法,从新发布的耦合模式比较计划第六阶段(CMIP6)中选择了两个对日本北海道石狩流域(IRB)最适用的全球气候模型(GCM)。在所有共享社会经济途径代表性浓度途径(SSP-RCP)情景(SSP1-1.9、SSP1-2.6、SSP2-4.5、SSP3-7.0、SSP4-3.4、SSP4-6.0、SSP5-3.4OS 和 SSP5-8.5)下,使用统计降尺度模型(SDSM)对气候变量(最高/最低温度和降水)进行预测,共分为两个阶段:2040-2069 年(2040 年代)和 2070-2099 年(2070 年代),1985-2014 年为基准期。SDSM 的预测因子来自 CMIP6 GCM 和再分析数据集 NOAA-CIRES-DOE 20 世纪再分析 V3(20CRv3)。结果表明,CMIP6 GCM 与温度测量值具有显著相关性,但无法代表 IRB 中的降水特征。所构建的 SDSM 分别能够捕捉到校准(1985-1999 年)和验证(2000-2014 年)阶段的温度和降水特征。所选 GCM(MIROC6 和 MRI-ESM-2.0)在未来阶段产生了更高的温度和更少的降水。SSP-RCP 情景对温度和降水有明显影响。高排放情景(即 SSP5-8.5)预计比低排放情景(如 SSP1-1.9)产生更高的温度和更低的降水。时空分析表明,在未来,IRB 的北部比南部更有可能变暖,降水更多。在整个 21 世纪后期(2070 年代),IRB 的温度比中期(2040 年代)更高,降水更少。本研究的结果可进一步用于预测水文循环并评估生态系统的可持续性。

https://cdn.ncbi.nlm.nih.gov/pmc/blobs/410f/9816114/5a8e2234ce09/41598_2022_27357_Fig12_HTML.jpg
https://cdn.ncbi.nlm.nih.gov/pmc/blobs/410f/9816114/8e538ef1d57b/41598_2022_27357_Fig1_HTML.jpg
https://cdn.ncbi.nlm.nih.gov/pmc/blobs/410f/9816114/de4d41a33a7b/41598_2022_27357_Fig2_HTML.jpg
https://cdn.ncbi.nlm.nih.gov/pmc/blobs/410f/9816114/88d1b8fa4de5/41598_2022_27357_Fig3_HTML.jpg
https://cdn.ncbi.nlm.nih.gov/pmc/blobs/410f/9816114/f65df16fa514/41598_2022_27357_Fig4_HTML.jpg
https://cdn.ncbi.nlm.nih.gov/pmc/blobs/410f/9816114/51bb6c63e69c/41598_2022_27357_Fig5_HTML.jpg
https://cdn.ncbi.nlm.nih.gov/pmc/blobs/410f/9816114/a0beb7ca609e/41598_2022_27357_Fig6_HTML.jpg
https://cdn.ncbi.nlm.nih.gov/pmc/blobs/410f/9816114/3c3e3e36ef88/41598_2022_27357_Fig7_HTML.jpg
https://cdn.ncbi.nlm.nih.gov/pmc/blobs/410f/9816114/6119210a6401/41598_2022_27357_Fig8_HTML.jpg
https://cdn.ncbi.nlm.nih.gov/pmc/blobs/410f/9816114/50ce26e0815a/41598_2022_27357_Fig9_HTML.jpg
https://cdn.ncbi.nlm.nih.gov/pmc/blobs/410f/9816114/4f364bc2ae98/41598_2022_27357_Fig10_HTML.jpg
https://cdn.ncbi.nlm.nih.gov/pmc/blobs/410f/9816114/1f11d839e215/41598_2022_27357_Fig11_HTML.jpg
https://cdn.ncbi.nlm.nih.gov/pmc/blobs/410f/9816114/5a8e2234ce09/41598_2022_27357_Fig12_HTML.jpg

相似文献

1
Climate change multi-model projections in CMIP6 scenarios in Central Hokkaido, Japan.日本北海道中央地区 CMIP6 情景下的气候变化多模式预估。
Sci Rep. 2023 Jan 5;13(1):230. doi: 10.1038/s41598-022-27357-7.
2
Projected changes in temperature, precipitation and potential evapotranspiration across Indus River Basin at 1.5-3.0 °C warming levels using CMIP6-GCMs.利用 CMIP6-GCM 预估在 1.5-3.0°C 变暖水平下印度河流域的温度、降水和潜在蒸散量变化。
Sci Total Environ. 2021 Oct 1;789:147867. doi: 10.1016/j.scitotenv.2021.147867. Epub 2021 May 20.
3
Predicted changes in future precipitation and air temperature across Bangladesh using CMIP6 GCMs.利用CMIP6全球气候模式预测孟加拉国未来降水和气温的变化。
Heliyon. 2023 May 13;9(5):e16274. doi: 10.1016/j.heliyon.2023.e16274. eCollection 2023 May.
4
A dataset of CMIP6-based climate scenarios for climate change impact assessment in Great Britain.一个基于CMIP6的气候情景数据集,用于英国气候变化影响评估。
Data Brief. 2024 Jul 4;55:110709. doi: 10.1016/j.dib.2024.110709. eCollection 2024 Aug.
5
Climate change projection using statistical downscaling model over southern coastal Iran.利用统计降尺度模型对伊朗南部沿海地区进行气候变化预测。
Heliyon. 2024 Apr 12;10(8):e29416. doi: 10.1016/j.heliyon.2024.e29416. eCollection 2024 Apr 30.
6
Projections of temperature and precipitation changes in Xinjiang from 2021 to 2050 based on the CMIP6 model.基于 CMIP6 模式的 2021 至 2050 年新疆气温和降水变化预测。
PLoS One. 2024 Oct 9;19(10):e0307911. doi: 10.1371/journal.pone.0307911. eCollection 2024.
7
Future precipitation and near surface air-temperature projection using CMIP6 models based on TOPSIS method: case study, Sistan-and-Baluchestan Province of Iran.利用基于 TOPSIS 方法的 CMIP6 模型对伊朗锡斯坦和俾路支省未来降水和近地表气温的预测:案例研究。
Environ Monit Assess. 2023 Nov 29;195(12):1548. doi: 10.1007/s10661-023-12084-x.
8
Spatiotemporal foresting of soil erosion for SSP-RCP scenarios considering local vegetation restoration project: A case study in the three gorges reservoir (TGR) area, China.考虑到当地植被恢复项目的 SSP-RCP 情景下的土壤侵蚀时空分形:以中国三峡库区为例。
J Environ Manage. 2023 Jul 1;337:117717. doi: 10.1016/j.jenvman.2023.117717. Epub 2023 Mar 21.
9
Future projections of temperature-related indices in Prince Edward Island using ensemble average of three CMIP6 models.使用三个CMIP6模型的集合平均值对爱德华王子岛与温度相关指数的未来预测。
Sci Rep. 2024 Jun 3;14(1):12661. doi: 10.1038/s41598-024-63450-9.
10
High-resolution climate projection dataset based on CMIP6 for Peru and Ecuador: BASD-CMIP6-PE.基于 CMIP6 的秘鲁和厄瓜多尔高分辨率气候预估数据集:BASD-CMIP6-PE。
Sci Data. 2024 Jan 5;11(1):34. doi: 10.1038/s41597-023-02863-z.

引用本文的文献

1
Tracing human influence on rising surface air temperature in Venezuela.追踪人类活动对委内瑞拉地表气温上升的影响。
Sci Rep. 2024 Nov 14;14(1):28005. doi: 10.1038/s41598-024-79671-x.
2
Projection of climate change impacts on extreme temperature and precipitation in Central Poland.气候变化对波兰中部极端温度和降水的影响预测。
Sci Rep. 2023 Oct 31;13(1):18772. doi: 10.1038/s41598-023-46199-5.
3
Assessing the Potential Distribution of , a Rapidly Spreading Weed, in East Asia under Global Climate Change.评估一种快速蔓延的杂草在全球气候变化下于东亚的潜在分布。

本文引用的文献

1
Surface warming-induced global acceleration of upper ocean currents.表面变暖导致上层海洋环流的全球加速。
Sci Adv. 2022 Apr 22;8(16):eabj8394. doi: 10.1126/sciadv.abj8394. Epub 2022 Apr 20.
2
Globally resolved surface temperatures since the Last Glacial Maximum.末次冰期以来的全球解析表面温度。
Nature. 2021 Nov;599(7884):239-244. doi: 10.1038/s41586-021-03984-4. Epub 2021 Nov 10.
3
Global Observations and CMIP6 Simulations of Compound Extremes of Monthly Temperature and Precipitation.全球月气温和降水复合极端事件的观测与CMIP6模拟
Plants (Basel). 2023 Sep 13;12(18):3254. doi: 10.3390/plants12183254.
4
Extreme climatic events to intensify over the Lake Victoria Basin under global warming.全球变暖背景下维多利亚湖流域极端气候事件将加剧。
Sci Rep. 2023 Jun 15;13(1):9729. doi: 10.1038/s41598-023-36756-3.
Geohealth. 2021 May 1;5(5):e2021GH000390. doi: 10.1029/2021GH000390. eCollection 2021 May.
4
Achievements and needs for the climate change scenario framework.气候变化情景框架的成果与需求。
Nat Clim Chang. 2020;10(12):1074-1084. doi: 10.1038/s41558-020-00952-0. Epub 2020 Nov 25.
5
Temperature variability implies greater economic damages from climate change.温度变化幅度大意味着气候变化造成的经济损失更大。
Nat Commun. 2020 Oct 6;11(1):5028. doi: 10.1038/s41467-020-18797-8.
6
Projections of drought characteristics in China based on a standardized precipitation and evapotranspiration index and multiple GCMs.基于标准化降水蒸散指数和多个 GCM 的中国干旱特征预估。
Sci Total Environ. 2020 Feb 20;704:135245. doi: 10.1016/j.scitotenv.2019.135245. Epub 2019 Nov 22.
7
The human imperative of stabilizing global climate change at 1.5°C.将全球气候变化稳定在 1.5°C 是人类的当务之急。
Science. 2019 Sep 20;365(6459). doi: 10.1126/science.aaw6974.
8
Precipitation characteristic changes due to global warming in a high-resolution (16 km) ECMWF simulation.基于欧洲中期天气预报中心(ECMWF)16公里高分辨率模拟的全球变暖导致的降水特征变化
Q J R Meteorol Soc. 2019 Jan;145(718):303-317. doi: 10.1002/qj.3432. Epub 2019 Jan 9.
9
Current fossil fuel infrastructure does not yet commit us to 1.5 °C warming.当前的化石燃料基础设施尚未使我们承诺将全球变暖控制在 1.5°C 以内。
Nat Commun. 2019 Jan 15;10(1):101. doi: 10.1038/s41467-018-07999-w.
10
Simulation climate change impact on runoff and sediment yield in a small watershed in the basque country, northern Spain.模拟气候变化对西班牙北部巴斯克地区一个小流域径流和产沙量的影响。
J Environ Qual. 2014 Jan;43(1):235-45. doi: 10.2134/jeq2012.0209.