• 文献检索
  • 文档翻译
  • 深度研究
  • 学术资讯
  • Suppr Zotero 插件Zotero 插件
  • 邀请有礼
  • 套餐&价格
  • 历史记录
应用&插件
Suppr Zotero 插件Zotero 插件浏览器插件Mac 客户端Windows 客户端微信小程序
定价
高级版会员购买积分包购买API积分包
服务
文献检索文档翻译深度研究API 文档MCP 服务
关于我们
关于 Suppr公司介绍联系我们用户协议隐私条款
关注我们

Suppr 超能文献

核心技术专利:CN118964589B侵权必究
粤ICP备2023148730 号-1Suppr @ 2026

文献检索

告别复杂PubMed语法,用中文像聊天一样搜索,搜遍4000万医学文献。AI智能推荐,让科研检索更轻松。

立即免费搜索

文件翻译

保留排版,准确专业,支持PDF/Word/PPT等文件格式,支持 12+语言互译。

免费翻译文档

深度研究

AI帮你快速写综述,25分钟生成高质量综述,智能提取关键信息,辅助科研写作。

立即免费体验

葡萄牙的 COVID-19 感染风险地理统计学地图。

Geostatistical COVID-19 infection risk maps for Portugal.

机构信息

CERENA, DECivil, Instituto Superior Técnico, Universidade de Lisboa, Av. Rovisco Pais, 1049-001, Lisbon, Portugal.

出版信息

Int J Health Geogr. 2020 Jul 6;19(1):25. doi: 10.1186/s12942-020-00221-5.

DOI:10.1186/s12942-020-00221-5
PMID:32631358
原文链接:https://pmc.ncbi.nlm.nih.gov/articles/PMC7336093/
Abstract

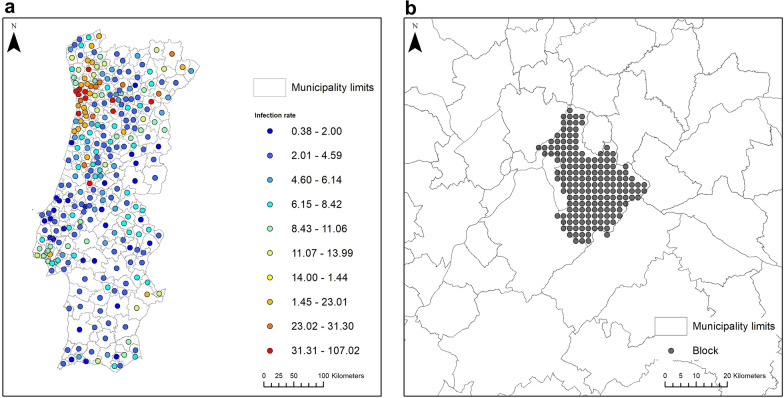
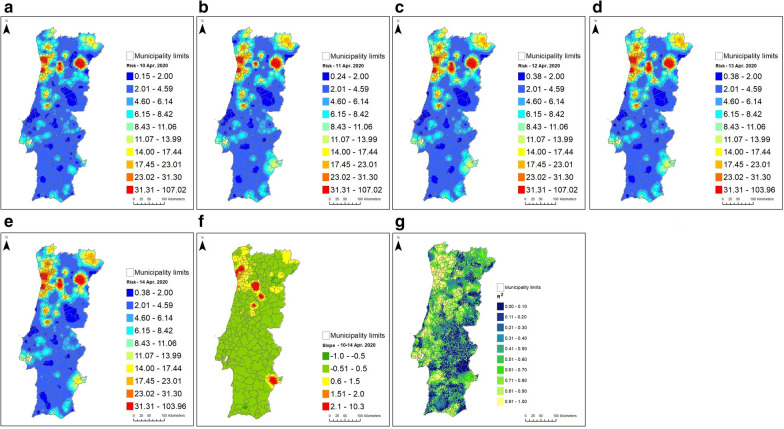
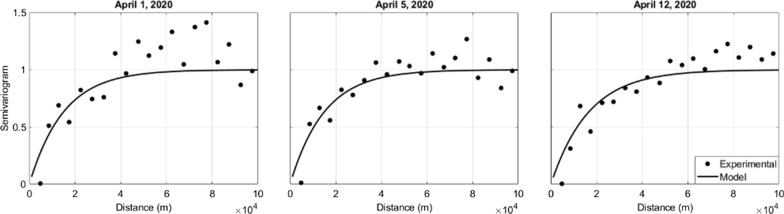
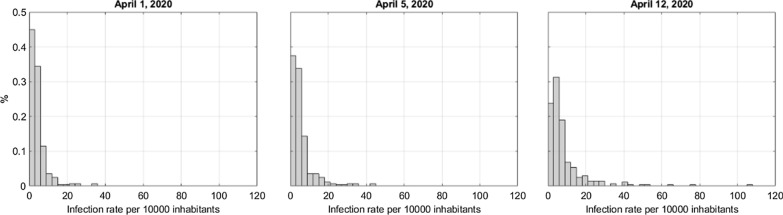
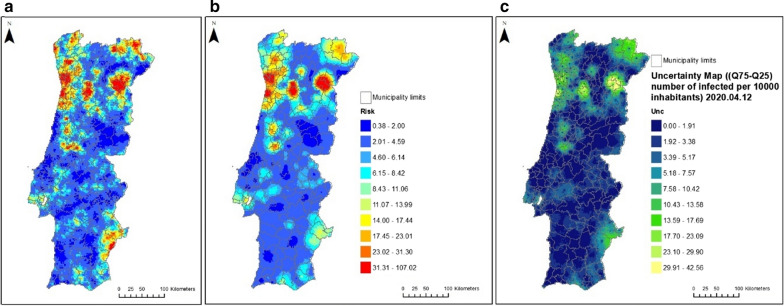
The rapid spread of the SARS-CoV-2 epidemic has simultaneous time and space dynamics. This behaviour results from a complex combination of factors, including social ones, which lead to significant differences in the evolution of the spatiotemporal pattern between and within countries. Usually, spatial smoothing techniques are used to map health outcomes, and rarely uncertainty of the spatial predictions are assessed. As an alternative, we propose to apply direct block sequential simulation to model the spatial distribution of the COVID-19 infection risk in mainland Portugal. Given the daily number of infection data provided by the Portuguese Directorate-General for Health, the daily updates of infection rates are calculated by municipality and used as experimental data in the geostatistical simulation. The model considers the uncertainty/error associated with the size of each municipality's population. The calculation of daily updates of the infection risk maps results from the median model of one ensemble of 100 geostatistical realizations of daily updates of the infection risk. The ensemble of geostatistical realizations is also used to calculate the associated spatial uncertainty of the spatial prediction using the interquartile distance. The risk maps are updated daily and show the regions with greater risks of infection and the critical dynamics related to its development over time.

摘要

SARS-CoV-2 疫情的迅速蔓延具有同时的时间和空间动态。这种行为是由多种因素共同作用的结果,包括社会因素,这导致了国家之间和国家内部时空模式演变的显著差异。通常,使用空间平滑技术来绘制健康结果,很少评估空间预测的不确定性。作为替代方法,我们建议应用直接块序贯模拟来模拟葡萄牙本土 COVID-19 感染风险的空间分布。考虑到葡萄牙卫生局提供的每日感染数据,我们按直辖市计算了感染率的每日更新,并将其用作地理统计学模拟中的实验数据。该模型考虑了与每个直辖市人口规模相关的不确定性/误差。感染风险地图的每日更新计算结果是对 100 个每日更新感染风险的地理统计学实现的集合中的中位数模型的计算结果。还使用地理统计学实现的集合来计算使用四分位距的空间预测的相关空间不确定性。风险地图每日更新,显示感染风险较高的地区以及与随时间发展相关的关键动态。

https://cdn.ncbi.nlm.nih.gov/pmc/blobs/b7e4/7336679/d44baeb831a4/12942_2020_221_Fig5_HTML.jpg
https://cdn.ncbi.nlm.nih.gov/pmc/blobs/b7e4/7336679/495009c2ee89/12942_2020_221_Fig1_HTML.jpg
https://cdn.ncbi.nlm.nih.gov/pmc/blobs/b7e4/7336679/154319f7bad2/12942_2020_221_Fig2_HTML.jpg
https://cdn.ncbi.nlm.nih.gov/pmc/blobs/b7e4/7336679/589dc957dd02/12942_2020_221_Fig3_HTML.jpg
https://cdn.ncbi.nlm.nih.gov/pmc/blobs/b7e4/7336679/36e2fff63ff5/12942_2020_221_Fig4_HTML.jpg
https://cdn.ncbi.nlm.nih.gov/pmc/blobs/b7e4/7336679/d44baeb831a4/12942_2020_221_Fig5_HTML.jpg

相似文献

1
Geostatistical COVID-19 infection risk maps for Portugal.葡萄牙的 COVID-19 感染风险地理统计学地图。
Int J Health Geogr. 2020 Jul 6;19(1):25. doi: 10.1186/s12942-020-00221-5.
2
High COVID-19 testing rate in Portugal.葡萄牙新冠病毒检测率高。
Lancet Infect Dis. 2020 Jul;20(7):783. doi: 10.1016/S1473-3099(20)30499-0.
3
Global impact of the COVID 19 Pandemic in Portuguese Thoracic Surgery Centres.新冠疫情在葡萄牙胸外科中心的全球影响。
Rev Port Cir Cardiotorac Vasc. 2020 Apr-Jun;27(2):69-71.
4
Initial Assessment of the Impact of the Emergency State Lockdown Measures on the 1st Wave of the COVID-19 Epidemic in Portugal.紧急状态封锁措施对葡萄牙第一波新冠疫情影响的初步评估
Acta Med Port. 2020 Nov 2;33(11):733-741. doi: 10.20344/amp.14129.
5
How did COVID-19 pandemic changed the Portuguese rheumatology?新冠疫情如何改变了葡萄牙的风湿病学?
Acta Reumatol Port. 2020 Jun 8;45(Jan-Mar (1)):5-6.
6
[Letter to the Editor Regarding the Article "Excess Mortality Estimation During the COVID-19 Pandemic: Preliminary Data from Portugal"].[致编辑的信:关于文章《新冠疫情期间的超额死亡率估计:来自葡萄牙的初步数据》]
Acta Med Port. 2020 Oct 1;33(10):705. doi: 10.20344/amp.14549. Epub 2020 Aug 19.
7
Current trends and future prediction of novel coronavirus disease (COVID-19) epidemic in China: a dynamical modeling analysis.中国新型冠状病毒病(COVID-19)疫情的现状和未来预测:动力学建模分析。
Math Biosci Eng. 2020 Apr 8;17(4):3052-3061. doi: 10.3934/mbe.2020173.
8
Population-based Estimates for High Risk of Severe COVID-19 Disease due to Age and Underlying Health Conditions.基于人群的因年龄和基础健康状况导致的重症 COVID-19 疾病高风险估计。
Acta Med Port. 2020 Nov 2;33(11):720-725. doi: 10.20344/amp.14222. Epub 2020 Jul 24.
9
Letter to the Editor Regarding Nogueira et al "Excess Mortality Estimation During the COVID-19 Pandemic: Preliminary Data from Portugal".致编辑的信:关于诺盖拉等人的“新冠疫情期间的超额死亡率估计:来自葡萄牙的初步数据”
Acta Med Port. 2020 Sep 1;33(9):625. doi: 10.20344/amp.14316.
10
Covid-19 during pregnancy: A case series from an universally tested population from the north of Portugal.孕期新冠病毒感染:来自葡萄牙北部普遍检测人群的病例系列。
Eur J Obstet Gynecol Reprod Biol. 2020 Jul;250:261-262. doi: 10.1016/j.ejogrb.2020.05.029. Epub 2020 May 15.

引用本文的文献

1
COVID-19 global risk evaluation: rankings, reducing surveillance bias, and infodemic.2019冠状病毒病全球风险评估:排名、减少监测偏差及信息疫情
Front Public Health. 2025 Aug 4;13:1589461. doi: 10.3389/fpubh.2025.1589461. eCollection 2025.
2
Analysis and prediction of infectious diseases based on spatial visualization and machine learning.基于空间可视化和机器学习的传染病分析与预测。
Sci Rep. 2024 Nov 19;14(1):28659. doi: 10.1038/s41598-024-80058-1.
3
Comparison of Soft Indicator and Poisson Kriging for the Noise-Filtering and Downscaling of Areal Data: Application to Daily COVID-19 Incidence Rates.

本文引用的文献

1
COVID-19: The forgotten priorities of the pandemic.COVID-19:大流行中被遗忘的优先事项。
Maturitas. 2020 Jun;136:38-41. doi: 10.1016/j.maturitas.2020.04.004. Epub 2020 Apr 14.
2
COVID-19 outbreak: Migration, effects on society, global environment and prevention.新冠疫情爆发:移民、对社会的影响、全球环境和预防。
Sci Total Environ. 2020 Aug 1;728:138882. doi: 10.1016/j.scitotenv.2020.138882. Epub 2020 Apr 22.
3
The socio-economic implications of the coronavirus pandemic (COVID-19): A review.冠状病毒大流行(COVID-19)的社会经济影响:综述。
用于区域数据噪声过滤和降尺度的软指标与泊松克里金法比较:应用于每日新冠疫情发病率
ISPRS Int J Geoinf. 2023 Aug;12(8). doi: 10.3390/ijgi12080328. Epub 2023 Aug 5.
4
Mathematical modeling applied to epidemics: an overview.应用于流行病的数学建模:综述。
Sao Paulo J Math Sci. 2021;15(2):1025-1044. doi: 10.1007/s40863-021-00268-7. Epub 2021 Sep 30.
5
Understanding spatiotemporal patterns of COVID-19 incidence in Portugal: A functional data analysis from August 2020 to March 2022.理解葡萄牙 COVID-19 发病率的时空模式:2020 年 8 月至 2022 年 3 月的功能数据分析。
PLoS One. 2024 Feb 1;19(2):e0297772. doi: 10.1371/journal.pone.0297772. eCollection 2024.
6
Urban COVID-19 endemism in Petrópolis: detection of an endemic focus by spatial analysis.佩特罗波利斯市的城市 COVID-19 地方性流行:通过空间分析检测地方性流行焦点。
Rev Peru Med Exp Salud Publica. 2023 Apr-Jun;40(2):213-219. doi: 10.17843/rpmesp.2023.402.11341.
7
Spatiotemporal evolution of COVID-19 in Portugal's Mainland with self-organizing maps.利用自组织映射研究葡萄牙本土 COVID-19 的时空演变。
Int J Health Geogr. 2023 Jan 29;22(1):4. doi: 10.1186/s12942-022-00322-3.
8
A multiple criteria approach for building a pandemic impact assessment composite indicator: The case of COVID-19 in Portugal.构建大流行影响评估综合指标的多标准方法:以葡萄牙的新冠肺炎疫情为例。
Eur J Oper Res. 2023 Sep 1;309(2):795-818. doi: 10.1016/j.ejor.2023.01.025. Epub 2023 Jan 18.
9
The Use of GIS Technology to Optimize COVID-19 Vaccine Distribution: A Case Study of the City of Warsaw, Poland.利用 GIS 技术优化 COVID-19 疫苗分发:以波兰华沙市为例。
Int J Environ Res Public Health. 2021 May 25;18(11):5636. doi: 10.3390/ijerph18115636.
10
Geospatial Analysis of COVID-19: A Scoping Review.新冠疫情的地理空间分析:范围综述。
Int J Environ Res Public Health. 2021 Feb 27;18(5):2336. doi: 10.3390/ijerph18052336.
Int J Surg. 2020 Jun;78:185-193. doi: 10.1016/j.ijsu.2020.04.018. Epub 2020 Apr 17.
4
Initial impacts of global risk mitigation measures taken during the combatting of the COVID-19 pandemic.在抗击新冠疫情期间采取的全球风险缓解措施的初步影响。
Saf Sci. 2020 Aug;128:104773. doi: 10.1016/j.ssci.2020.104773. Epub 2020 Apr 15.
5
Evidence based management guideline for the COVID-19 pandemic - Review article.基于证据的 COVID-19 大流行管理指南 - 综述文章。
Int J Surg. 2020 May;77:206-216. doi: 10.1016/j.ijsu.2020.04.001. Epub 2020 Apr 11.
6
Commentary on Ferguson, et al., "Impact of Non-pharmaceutical Interventions (NPIs) to Reduce COVID-19 Mortality and Healthcare Demand".评 Ferguson 等人的“减少 COVID-19 死亡率和医疗需求的非药物干预(NPIs)的影响”一文。
Bull Math Biol. 2020 Apr 8;82(4):52. doi: 10.1007/s11538-020-00726-x.
7
How will country-based mitigation measures influence the course of the COVID-19 epidemic?基于国家的缓解措施将如何影响新冠疫情的发展进程?
Lancet. 2020 Mar 21;395(10228):931-934. doi: 10.1016/S0140-6736(20)30567-5. Epub 2020 Mar 9.
8
Geostatistical analysis of disease data: accounting for spatial support and population density in the isopleth mapping of cancer mortality risk using area-to-point Poisson kriging.疾病数据的地统计分析:在使用面积到点的泊松克里金法绘制癌症死亡风险等值线图时考虑空间支持和人口密度。
Int J Health Geogr. 2006 Nov 30;5:52. doi: 10.1186/1476-072X-5-52.
9
Geostatistical analysis of disease data: estimation of cancer mortality risk from empirical frequencies using Poisson kriging.疾病数据的地质统计学分析:使用泊松克里金法从经验频率估计癌症死亡风险。
Int J Health Geogr. 2005 Dec 14;4:31. doi: 10.1186/1476-072X-4-31.