Hossain Md Amir, Sarker Umakanta, Azam Md Golam, Kobir Md Shahriar, Roychowdhury Rajib, Ercisli Sezai, Ali Daoud, Oba Shinya, Golokhvast Kirill S
Department of Genetics and Plant Breeding, Faculty of Agriculture, Bangladesh Agricultural University, Mymensingh 2202, Bangladesh.
Department of Genetics and Plant Breeding, Faculty of Agriculture, Bangabandhu Sheikh Mujibur Rahman Agricultural University, Gazipur 1706, Bangladesh.
Plants (Basel). 2023 May 23;12(11):2079. doi: 10.3390/plants12112079.
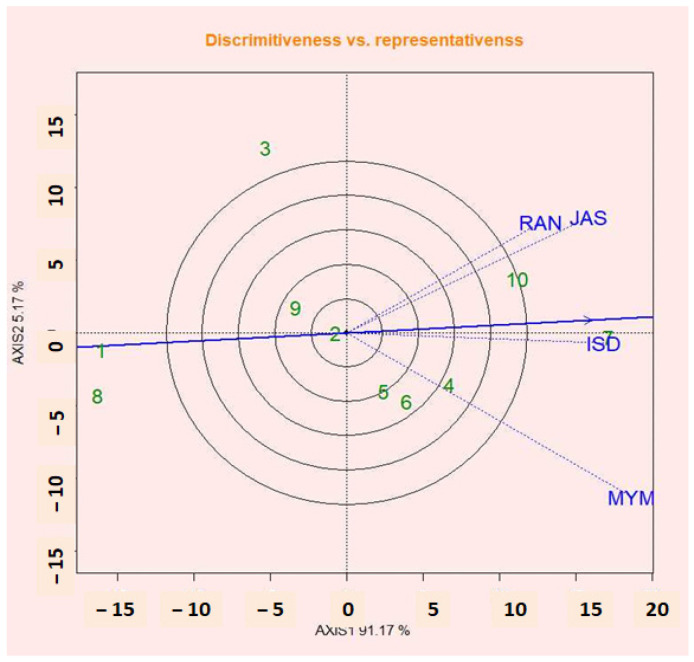
Lentil yield is a complicated quantitative trait; it is significantly influenced by the environment. It is crucial for improving human health and nutritional security in the country as well as for a sustainable agricultural system. The study was laid out to determine the stable genotype through the collaboration of G × E by AMMI and GGE biplot and to identify the superior genotypes using 33 parametric and non-parametric stability statistics of 10 genotypes across four different conditions. The total G × E effect was divided into two primary components by the AMMI model. For days to flowering, days to maturity, plant height, pods per plant, and hundred seed weight, IPCA1 was significant and accounted for 83%, 75%, 100%, and 62%, respectively. Both IPCA1 and IPCA2 were non-significant for yield per plant and accounted for 62% of the overall G × E interaction. An estimated set of eight stability parameters showed strong positive correlations with mean seed yield, and these measurements can be utilized to choose stable genotypes. The productivity of lentils has varied greatly in the environment, ranging from 786 kg per ha in the MYM environment to 1658 kg per ha in the ISD environment, according to the AMMI biplot. Three genotypes (G8, G7, and G2) were shown to be the most stable based on non-parametric stability scores for grain yield. G8, G7, G2, and G5 were determined as the top lentil genotypes based on grain production using numerical stability metrics such as Francis's coefficient of variation, Shukla stability value (σi), and Wrick's ecovalence (Wi). Genotypes G7, G10, and G4 were the most stable with the highest yield, according to BLUP-based simultaneous selection stability characteristics. The findings of graphic stability methods such as AMMI and GGE for identifying the high-yielding and stable lentil genotypes were very similar. While the GGE biplot indicated G2, G10, and G7 as the most stable and high-producing genotypes, AMMI analysis identified G2, G9, G10, and G7. These selected genotypes would be used to release a new variety. Considering all the stability models, such as Eberhart and Russell's regression and deviation from regression, additive main effects, multiplicative interactions (AMMI) analysis, and GGE, the genotypes G2, G9, and G7 could be used as well-adapted genotypes with moderate grain yield in all tested environments.
小扁豆产量是一个复杂的数量性状,受环境影响显著。这对于改善该国人类健康和营养安全以及可持续农业系统至关重要。本研究旨在通过加性主效应乘积交互作用(AMMI)模型和基因型主效应与基因型与环境互作双标图(GGE双标图)的G×E协作来确定稳定基因型,并使用10个基因型在四种不同条件下的33种参数和非参数稳定性统计量来鉴定优良基因型。AMMI模型将总的G×E效应分为两个主要成分。对于开花天数、成熟天数、株高、单株荚数和百粒重,主成分分析1(IPCA1)显著,分别占83%、75%、100%和62%。对于单株产量,IPCA1和IPCA2均不显著,占总体G×E互作的62%。一组估计的八个稳定性参数与平均种子产量呈强正相关,这些测量值可用于选择稳定基因型。根据AMMI双标图,小扁豆在不同环境下的产量差异很大,从雨养旱作(MYM)环境下的每公顷786千克到灌溉雨养双重种植(ISD)环境下的每公顷1658千克。基于籽粒产量的非参数稳定性得分,三种基因型(G8、G7和G2)表现为最稳定。基于弗朗西斯变异系数、舒克拉稳定性值(σi)和里克生态等价性(Wi)等数值稳定性指标,G8、G7、G2和G5被确定为顶级小扁豆基因型。根据基于最佳线性无偏预测(BLUP)的同时选择稳定性特征,基因型G7、G10和G4产量最高且最稳定。AMMI和GGE等图形稳定性方法在鉴定高产稳定小扁豆基因型方面的结果非常相似。虽然GGE双标图表明G2、G10和G7是最稳定和高产的基因型,但AMMI分析确定的是G2、G9、G10和G7。这些选定的基因型将用于培育新品种。综合考虑所有稳定性模型,如埃伯哈特和拉塞尔回归及回归偏差、加性主效应、乘积交互作用(AMMI)分析和GGE,基因型G2、G9和G7可作为在所有测试环境中适应性良好、籽粒产量中等的基因型。